


Shiba Inu Price Forecast: On-chain data raises bull trap risks



- Shiba Inu’s price nears the 50-day EMA at $0.0000060 on Thursday, following a slight recovery the previous day.
- On-chain data shows SHIB’s rising dormant wallet activity alongside spikes in NPL and trading volume, signaling a bearish move ahead.
- Traders should be cautious, as a bull trap may be forming.
Shiba Inu (SHIB) price nears key resistance level, trading at $0.0000060 as of writing on Thursday, which dictates the next directional move. On-chain data metrics suggest a bearish outlook, as a surge in dormant wallet activity alongside spikes in the Network Realized Profit/Loss (NPL) indicator and trading volume. Traders should remain cautious as downside risks appear to outweigh short-term recovery.
On-chain data signals caution
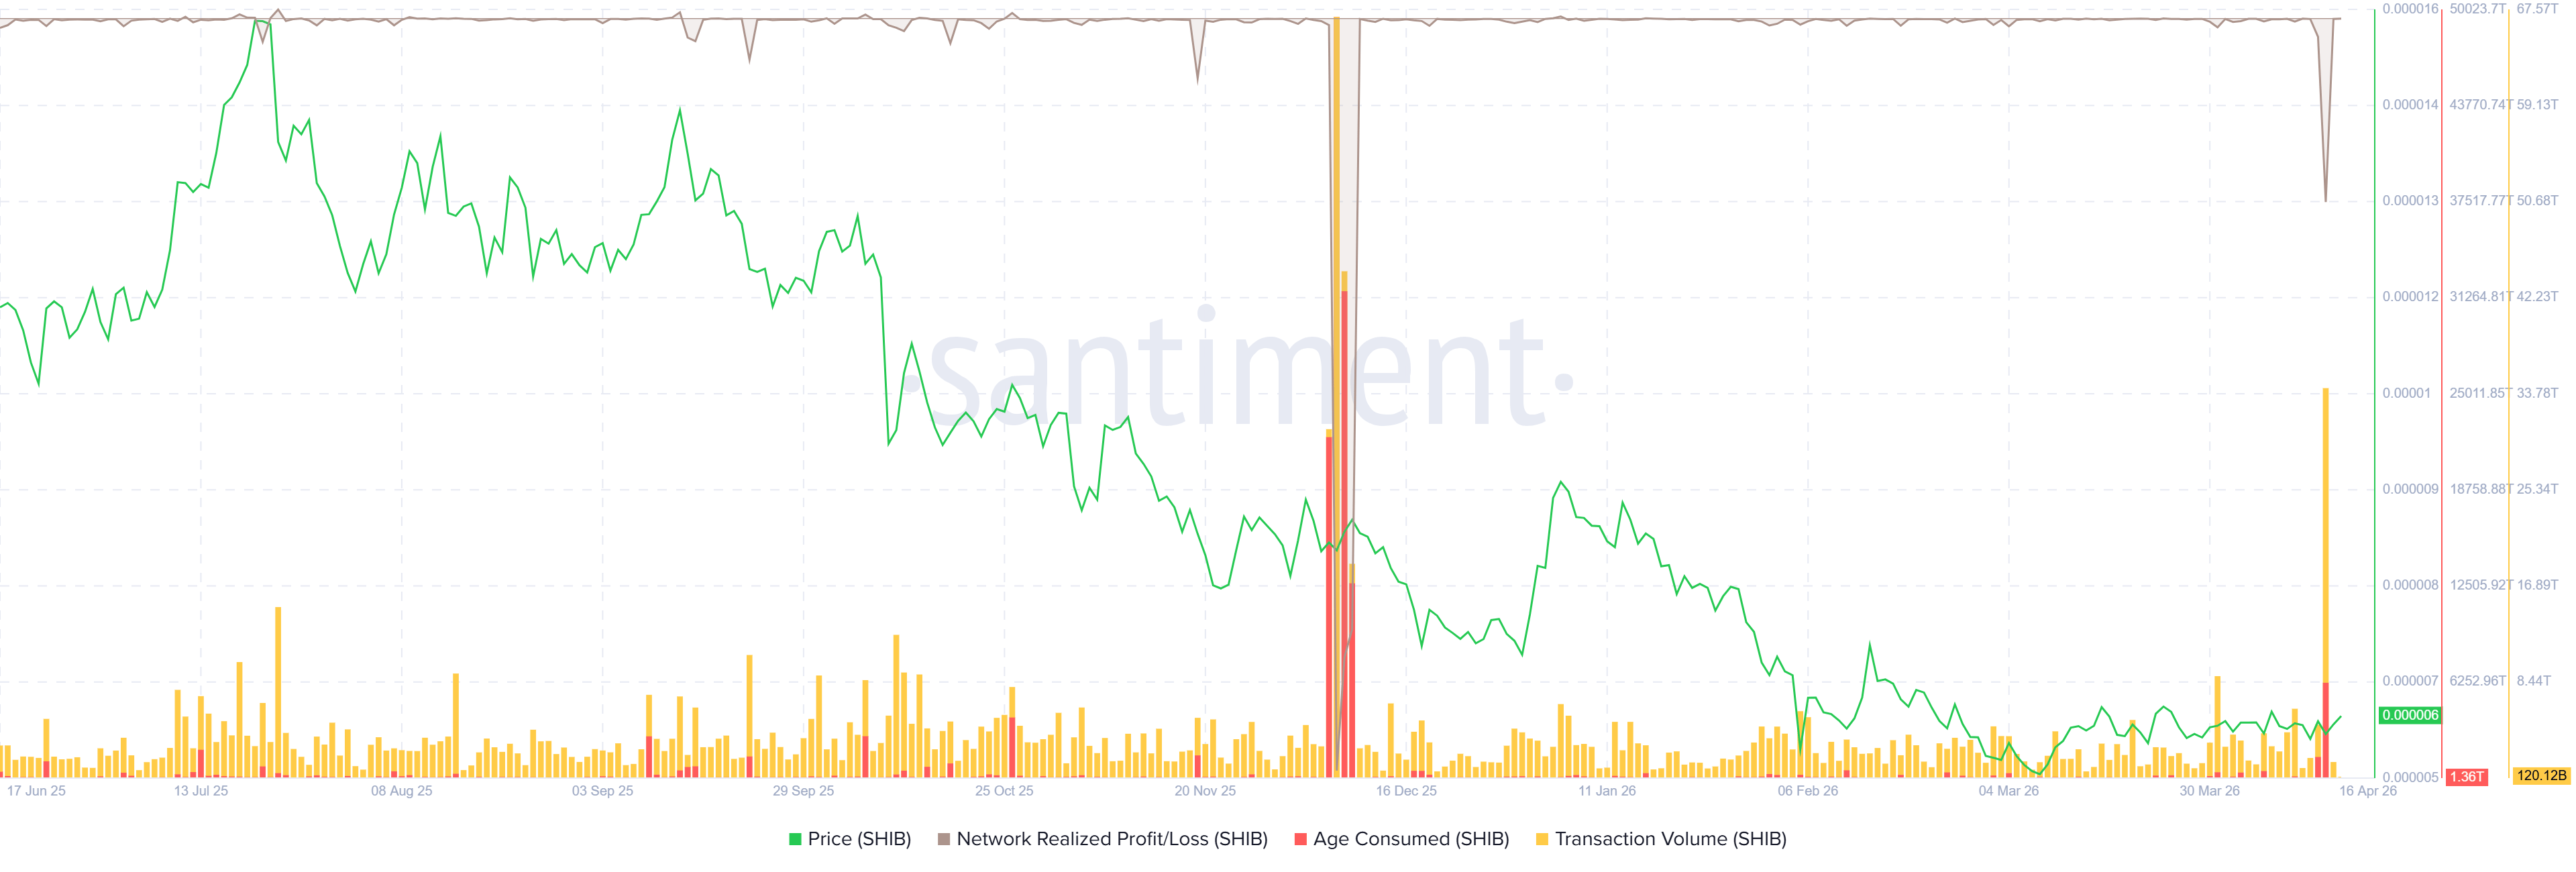
Santiment data indicates signs of concern for Shiba Inu. The chart below shows that Santiment’s Network Realized Profit/Loss (NPL) indicator computes a daily network-level Return On Investment (ROI) based on the coin’s on-chain transaction volume, which measures market pain. The metric shows a massive dip on Tuesday, indicating that holders, on average, were realizing losses.
During the same period, Santiment’s Age Consumed index and transaction volume also showed an upward spike, suggesting dormant tokens (tokens stored in wallets for a long time) are in motion.
Historically, a surge in dormant wallet activity and transaction volume, combined with a negative spike in the NPL indicator, has often triggered a brief price rally, followed by sell-offs (bull traps) in Shiba Inu.
A similar pattern was observed in early December, when the price rose slightly first, followed by a sharp price correction in SHIB, suggesting distribution rather than accumulation.
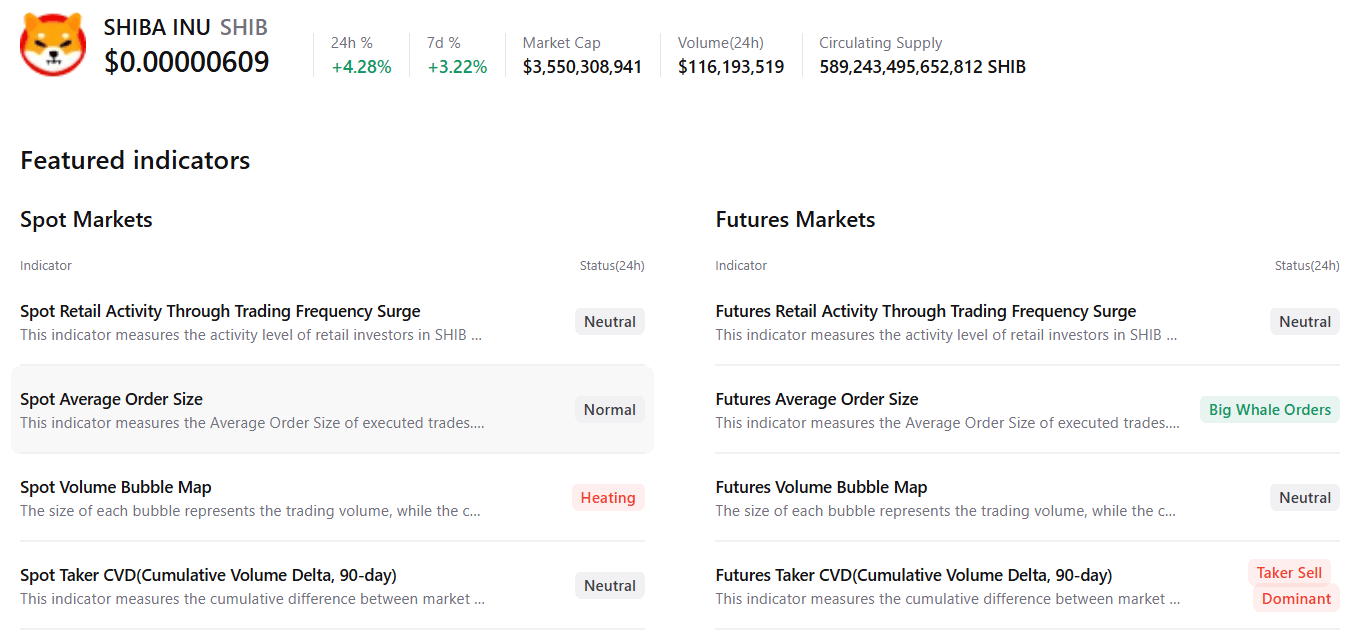
CryptoQuant summary data also suggests a slight bearish outlook for SHIB. The chart below shows that the presence of large orders in the futures markets hints at some optimism. However, the heating conditions and the sell-side dominance, with mostly neutral conditions across other metrics, suggest a potential downside move.
Shiba Inu Price Forecast: SHIB nears key resistance zone
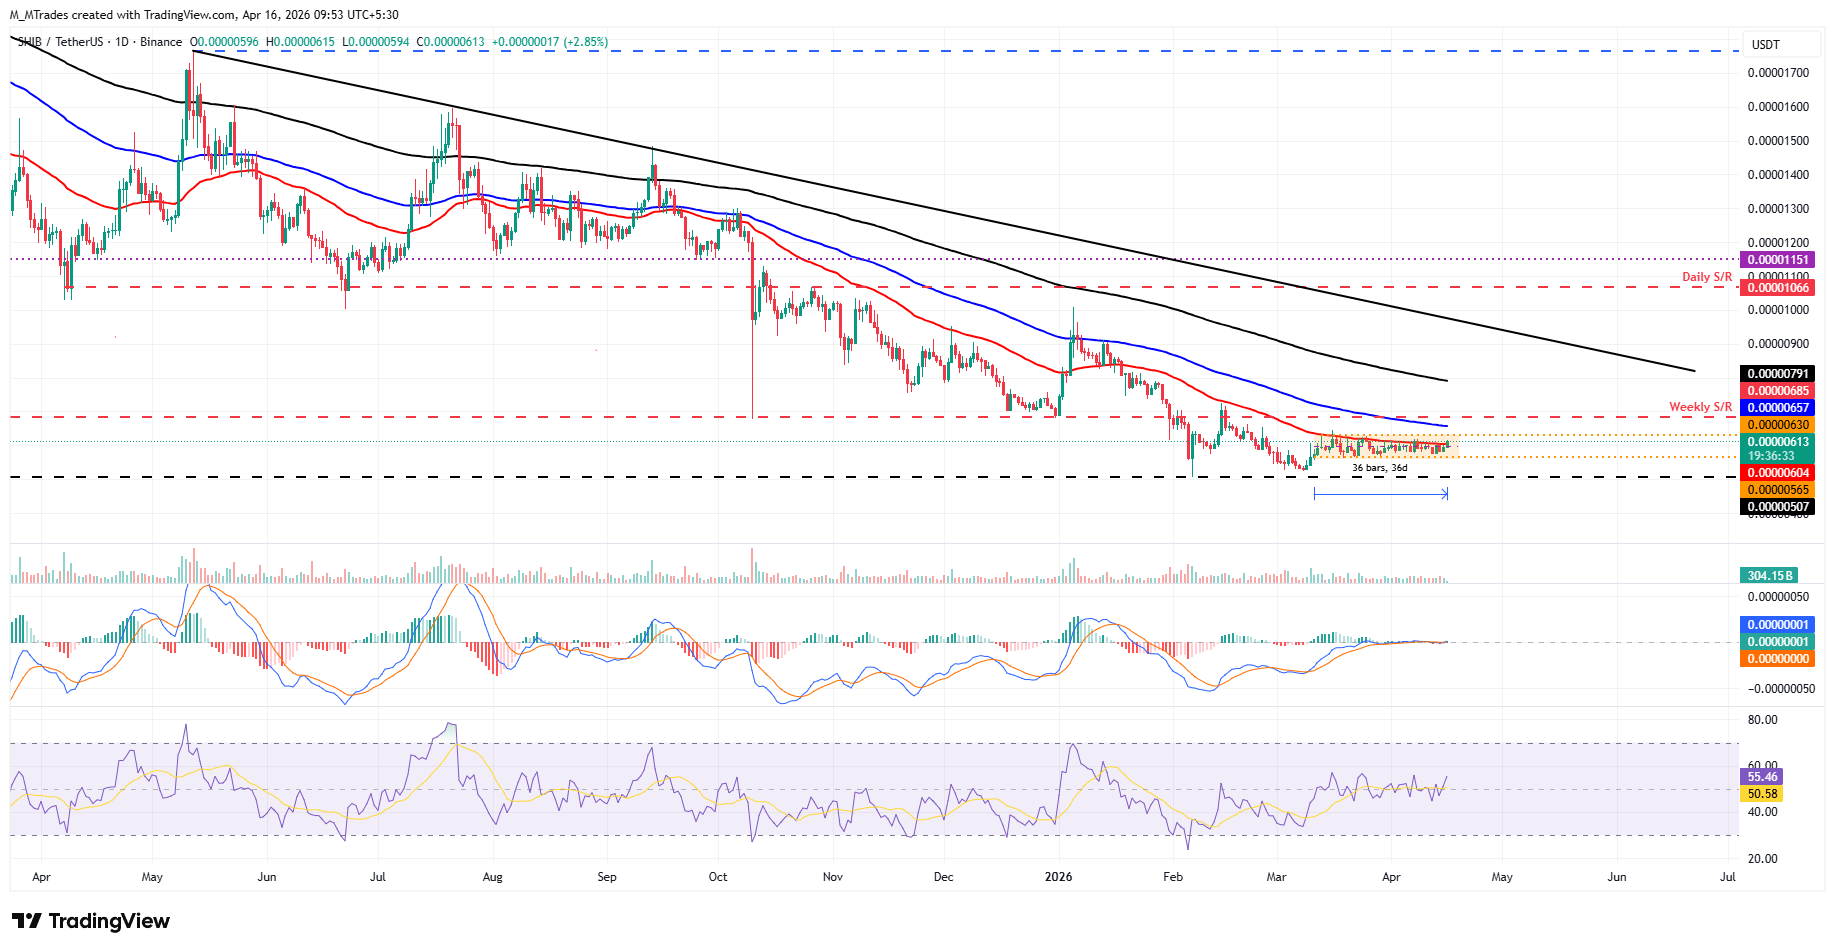
Shiba Inu price has been trading sideways for more than one month between $0.0000056 and $0.0000063, following a massive downward trend. As of writing on Thursday, SHIB is trading slightly higher above the 50-day Exponential Moving Average (EMA) at $0.0000060.
The breakout or breakdown will dictate SHIB’s next directional move; however, traders should be cautious, as the primary trend for the meme coin remains bearish, and any short-term recovery could face corrections.
The Relative Strength Index (RSI) on the daily chart reads 55, just above the neutral level of 50, indicating fading bearish momentum. The Moving Average Convergence Divergence (MACD) lines coil against each other, suggesting indecision among the traders.
The immediate resistance for SHIB could be seen near the 50-day EMA, followed by the upper consolidation boundary, then the 100-day EMA near $0.0000065. A close above the 100-day EMA could extend recovery toward the weekly resistance at $0.0000068.
On the downside, the immediate support lies around the lower consolidation boundary at $0.0000056, where a breakdown could trigger a deeper correction toward the horizontal support near $0.0000050.
Recommended Articles








Comments (0)
Click the $ button, enter the symbol, and select to link a stock, ETF, or other ticker.