


Crypto Today: Bitcoin and Ethereum sustain recovery, XRP stalls amid retail investors’ return



- Bitcoin holds modest gains, with $74,000 serving as immediate support, buoyed by growing retail demand.
- Ethereum rises, trading above the 50-day and 100-day EMAs as bulls build on a steady derivatives comeback.
- XRP stalls below the $1.40 supply zone despite the MACD maintaining a buy signal.
The cryptocurrency market continues to display signs of resilience amid the tensions in the Middle East, with Bitcoin (BTC) extending its rebound above $74,000 at the time of writing on Tuesday.
Although the ceasefire between the United States (US) and Iran is holding, the US blockade of the Strait of Hormuz further disrupts the flow of Oil and Gas supplies.
Meanwhile, renewed retail participation is fuelling upward momentum in major altcoins, with Ethereum (ETH) rising above $2,300 and Ripple (XRP) trading around $1.37, though it appears to be stalling below $1.40.
Renewed retail interest lifts BTC, ETH and XRP outlook
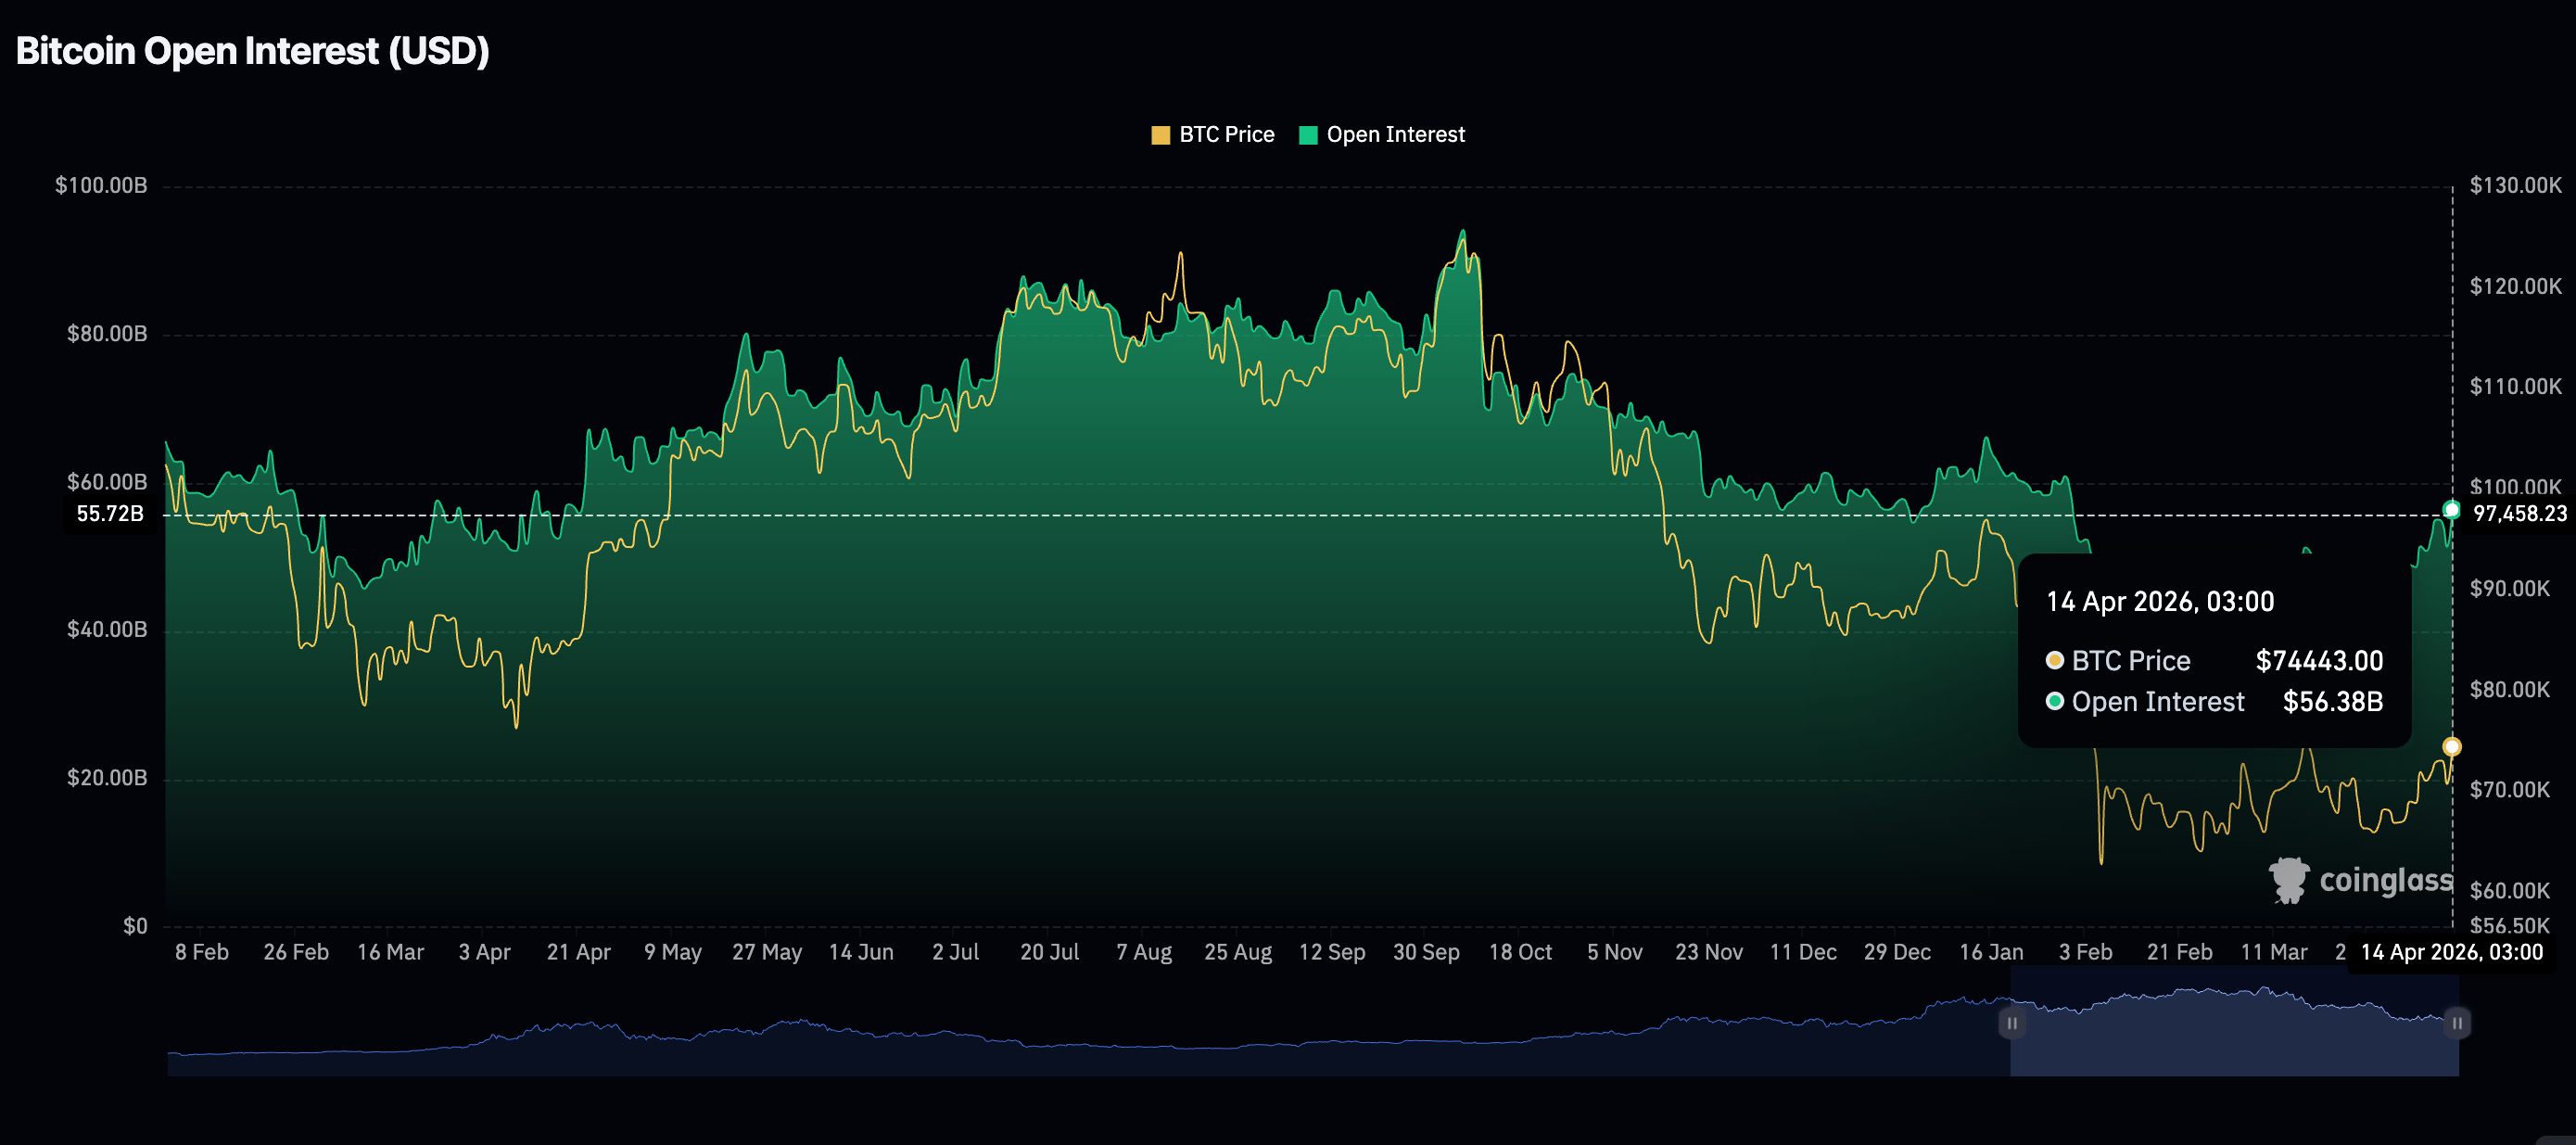
Retail interest in Bitcoin derivatives aligns with the price increase above $74,000, as reflected in futures Open Interest (OI), which averages $56.38 billion on Tuesday, up from $51.39 billion the previous day. Such growth in retail risk appetite implies that investors are gaining confidence in Bitcoin’s short-term outlook and are willing to open new positions.
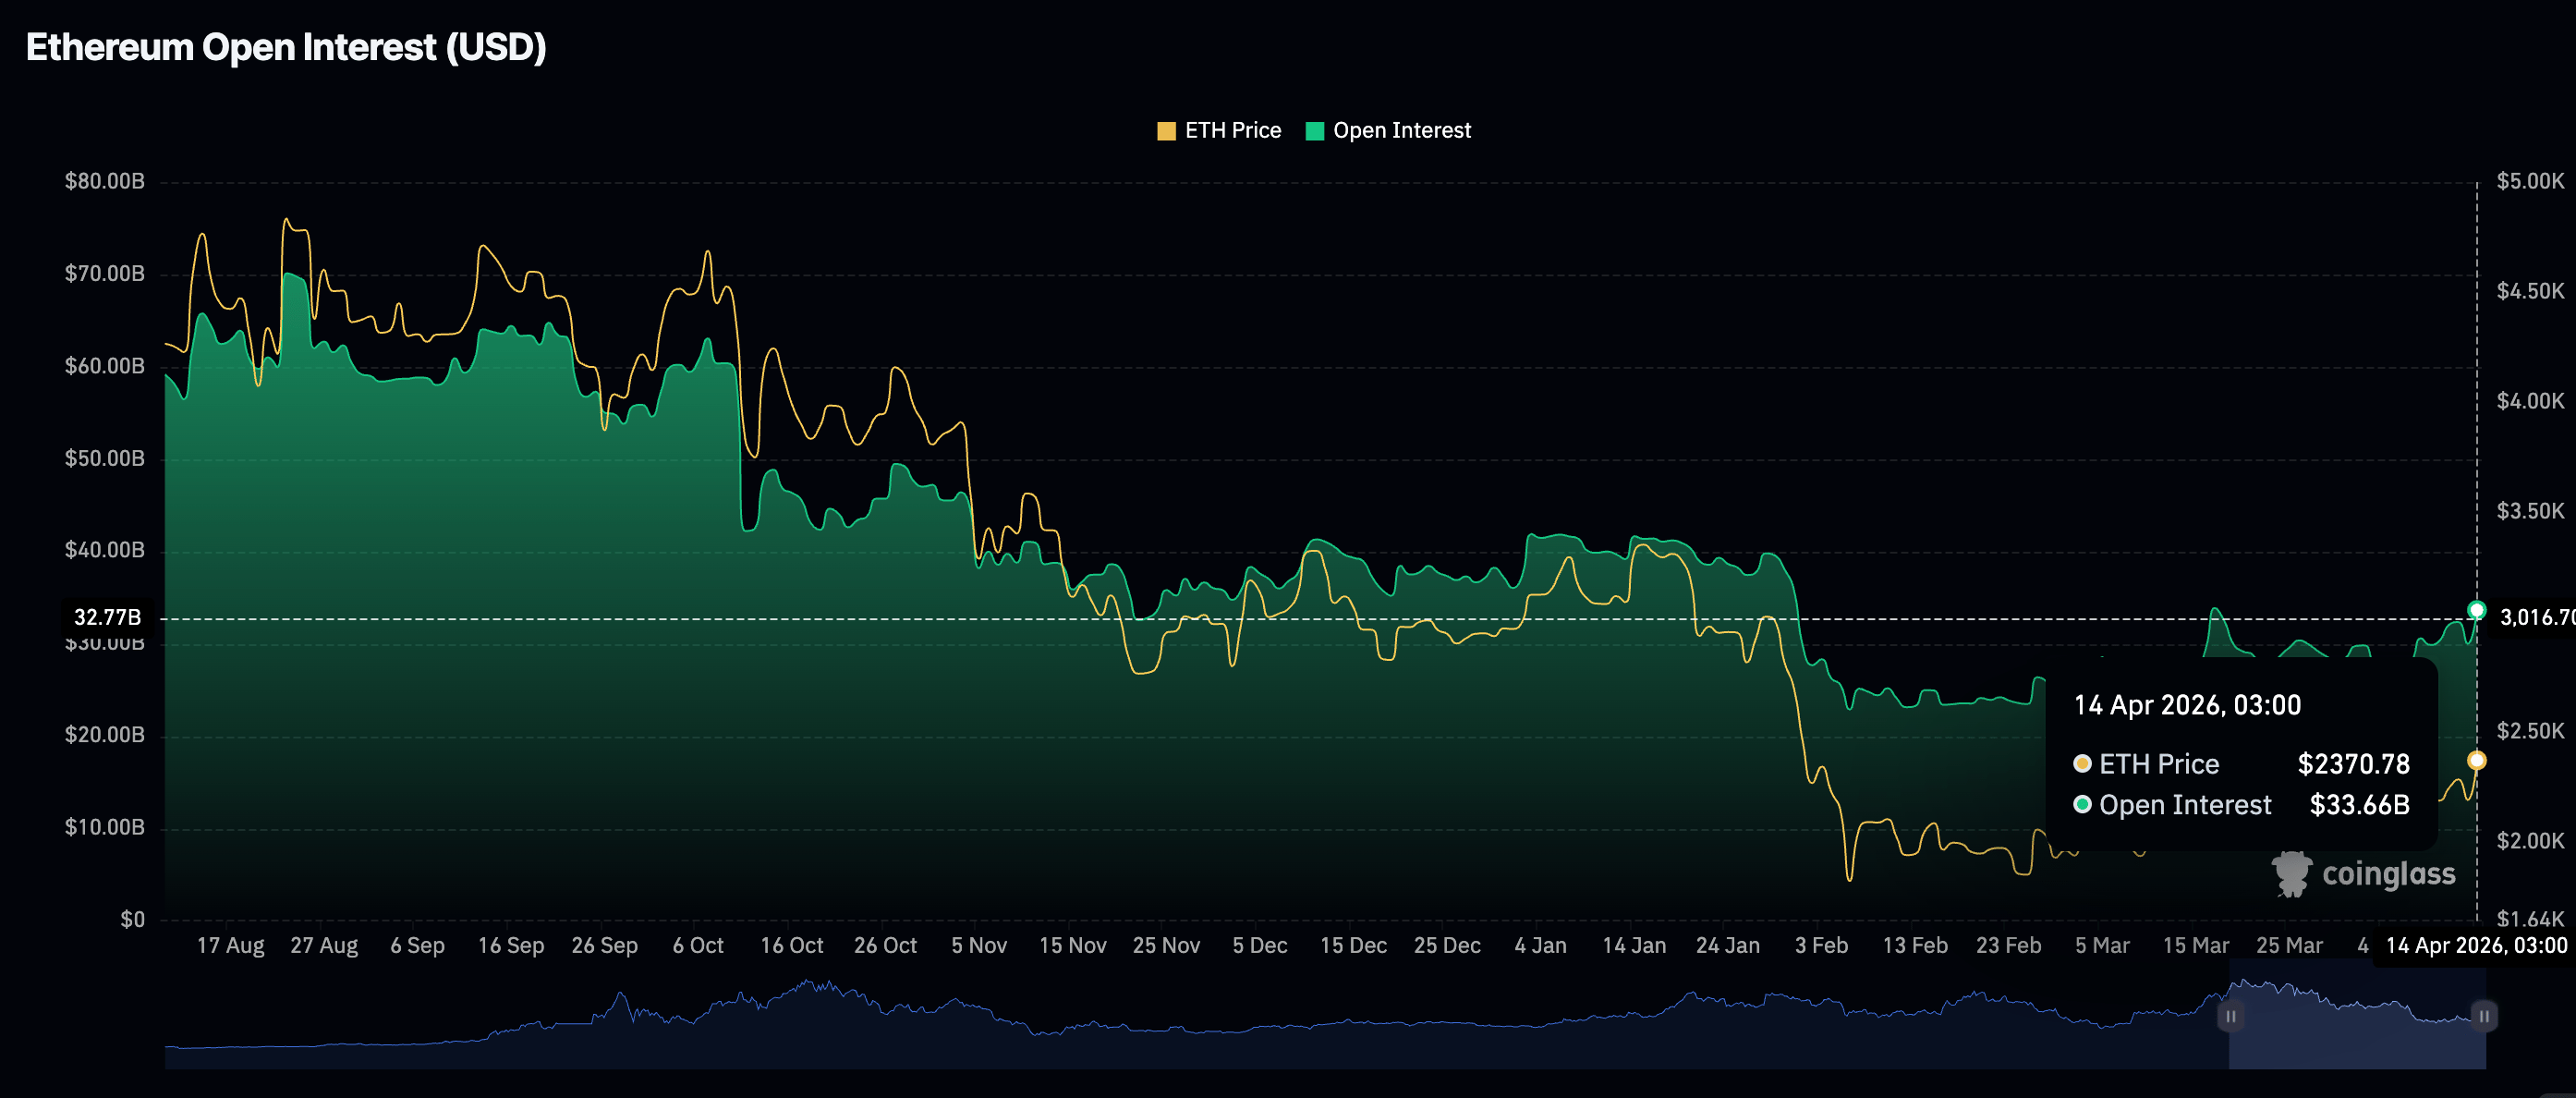
Investors are expanding their risk appetite, as Ethereum futures OI stands at $33.66 billion on Tuesday, up from $30.02 billion the previous day. With prices trending upward, market sentiment across crypto assets is turning increasingly bullish, suggesting a higher likelihood of continued upward momentum.
XRP is also experiencing an influx of retail capital, as futures OI expands to $2.57 billion on Tuesday, from $2.38 billion the previous day. A growing and liquid derivatives market serves as a foundation for sustained price recovery, underpinning investor confidence and supporting long-term growth in risk assets such as XRP.
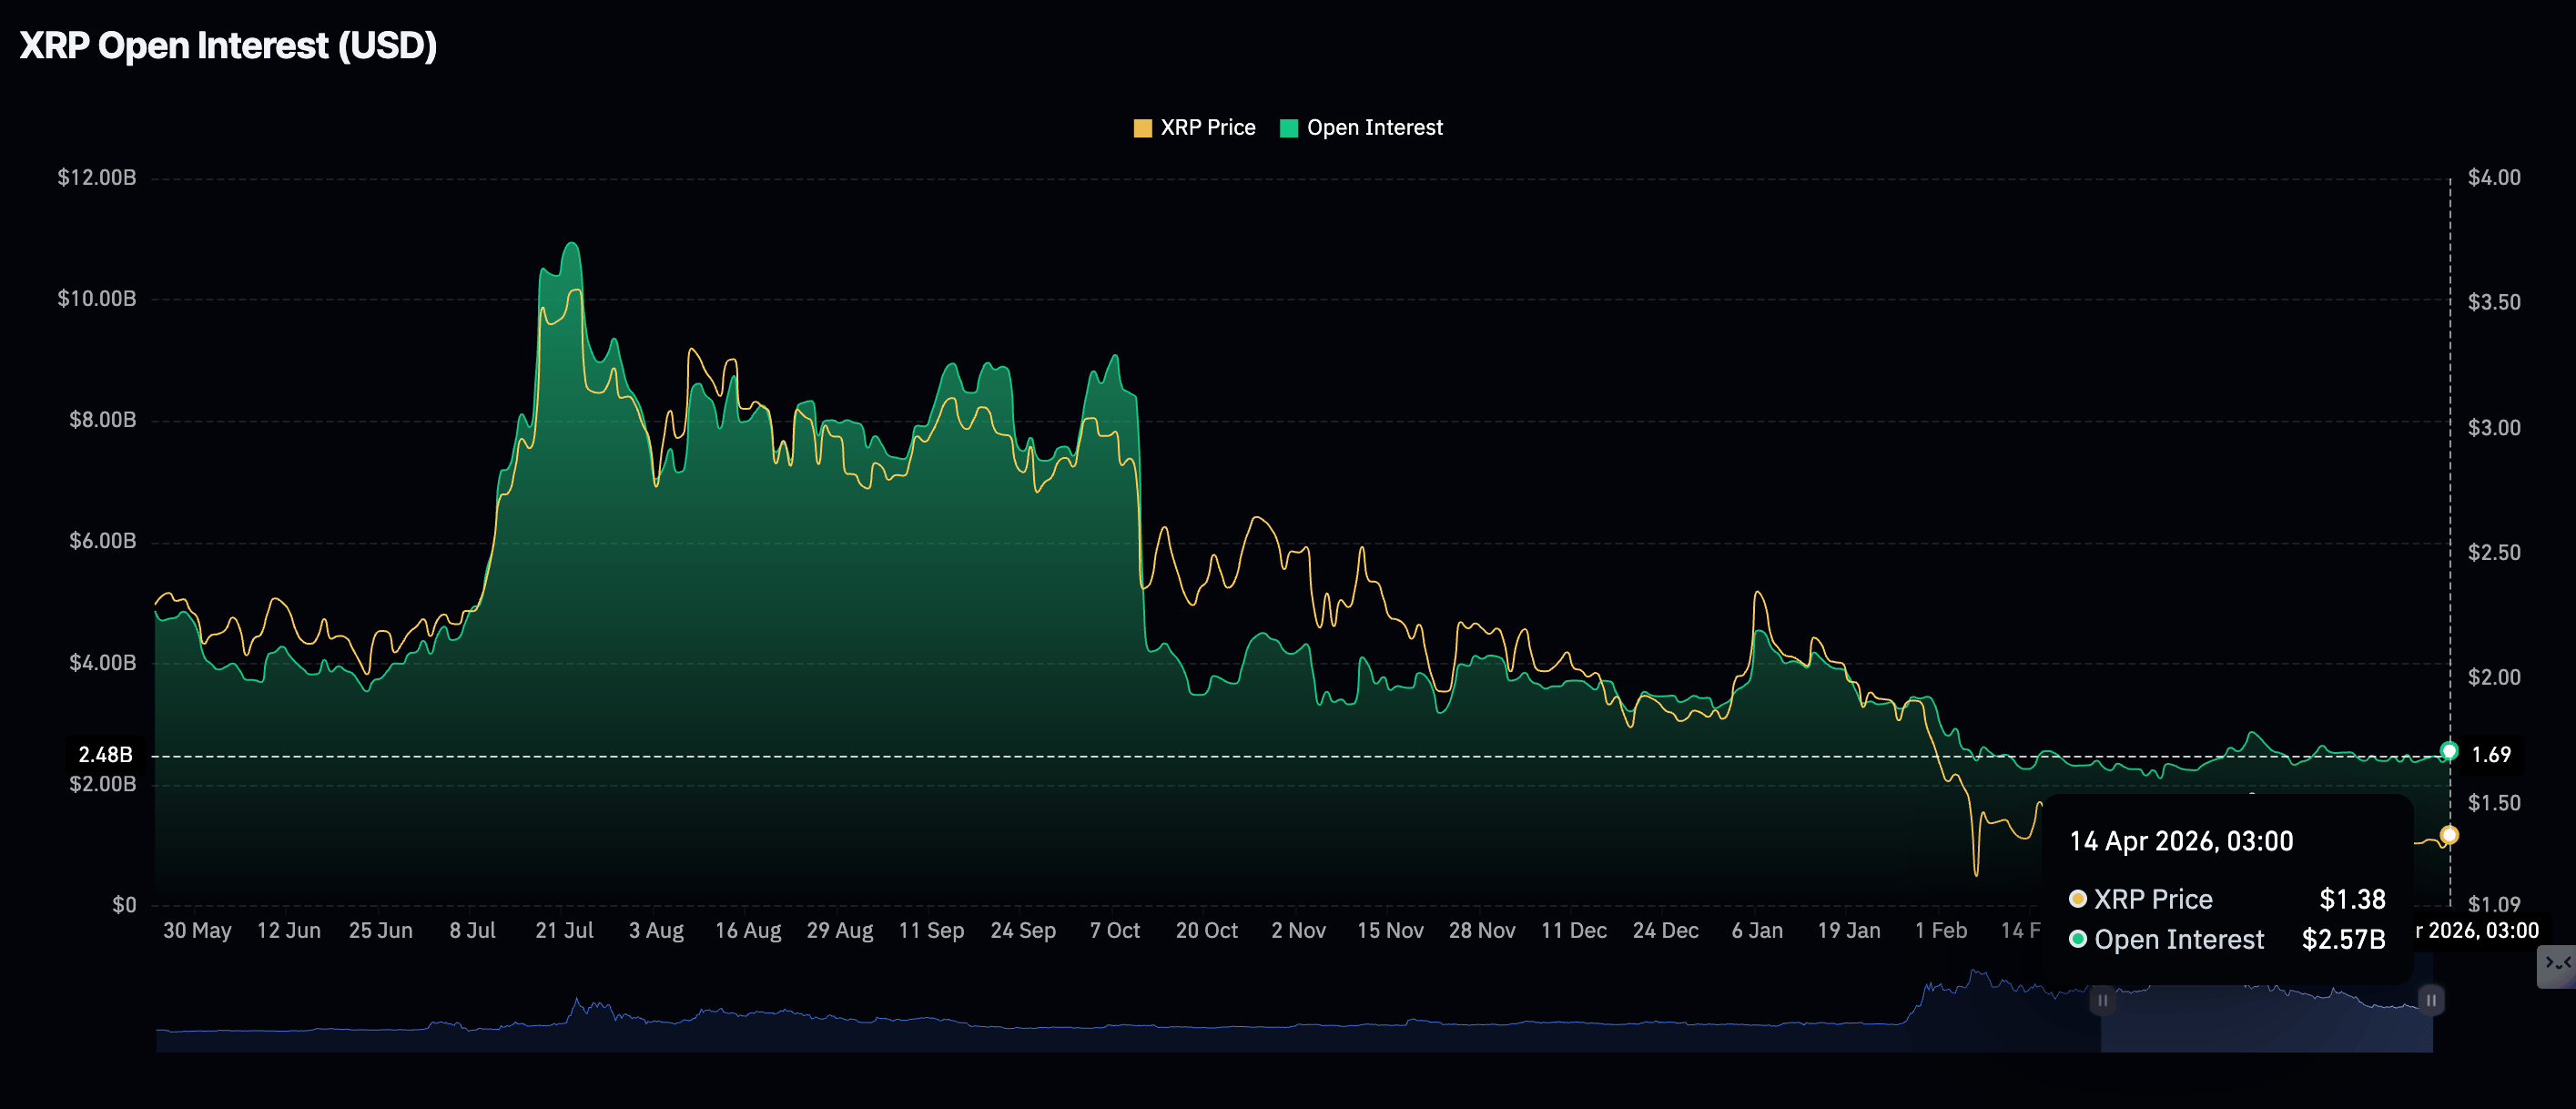
Chart of the day: Bitcoin’s rebound builds on stronger technical signals
Bitcoin holds modest gains and trades at $74,542 at the time of writing on Tuesday, keeping a constructive bullish bias. The Crypto King holds well above the 50-day Exponential Moving Average (EMA) at $71,022 and has reclaimed the broken downtrend resistance line around $73,168 as support.
Momentum indicators such as the Moving Average Convergence Divergence (MACD) hold in positive territory on the daily chart, while the Relative Strength Index (RSI) at 62 suggests healthy upside momentum without yet signaling extreme overbought conditions.
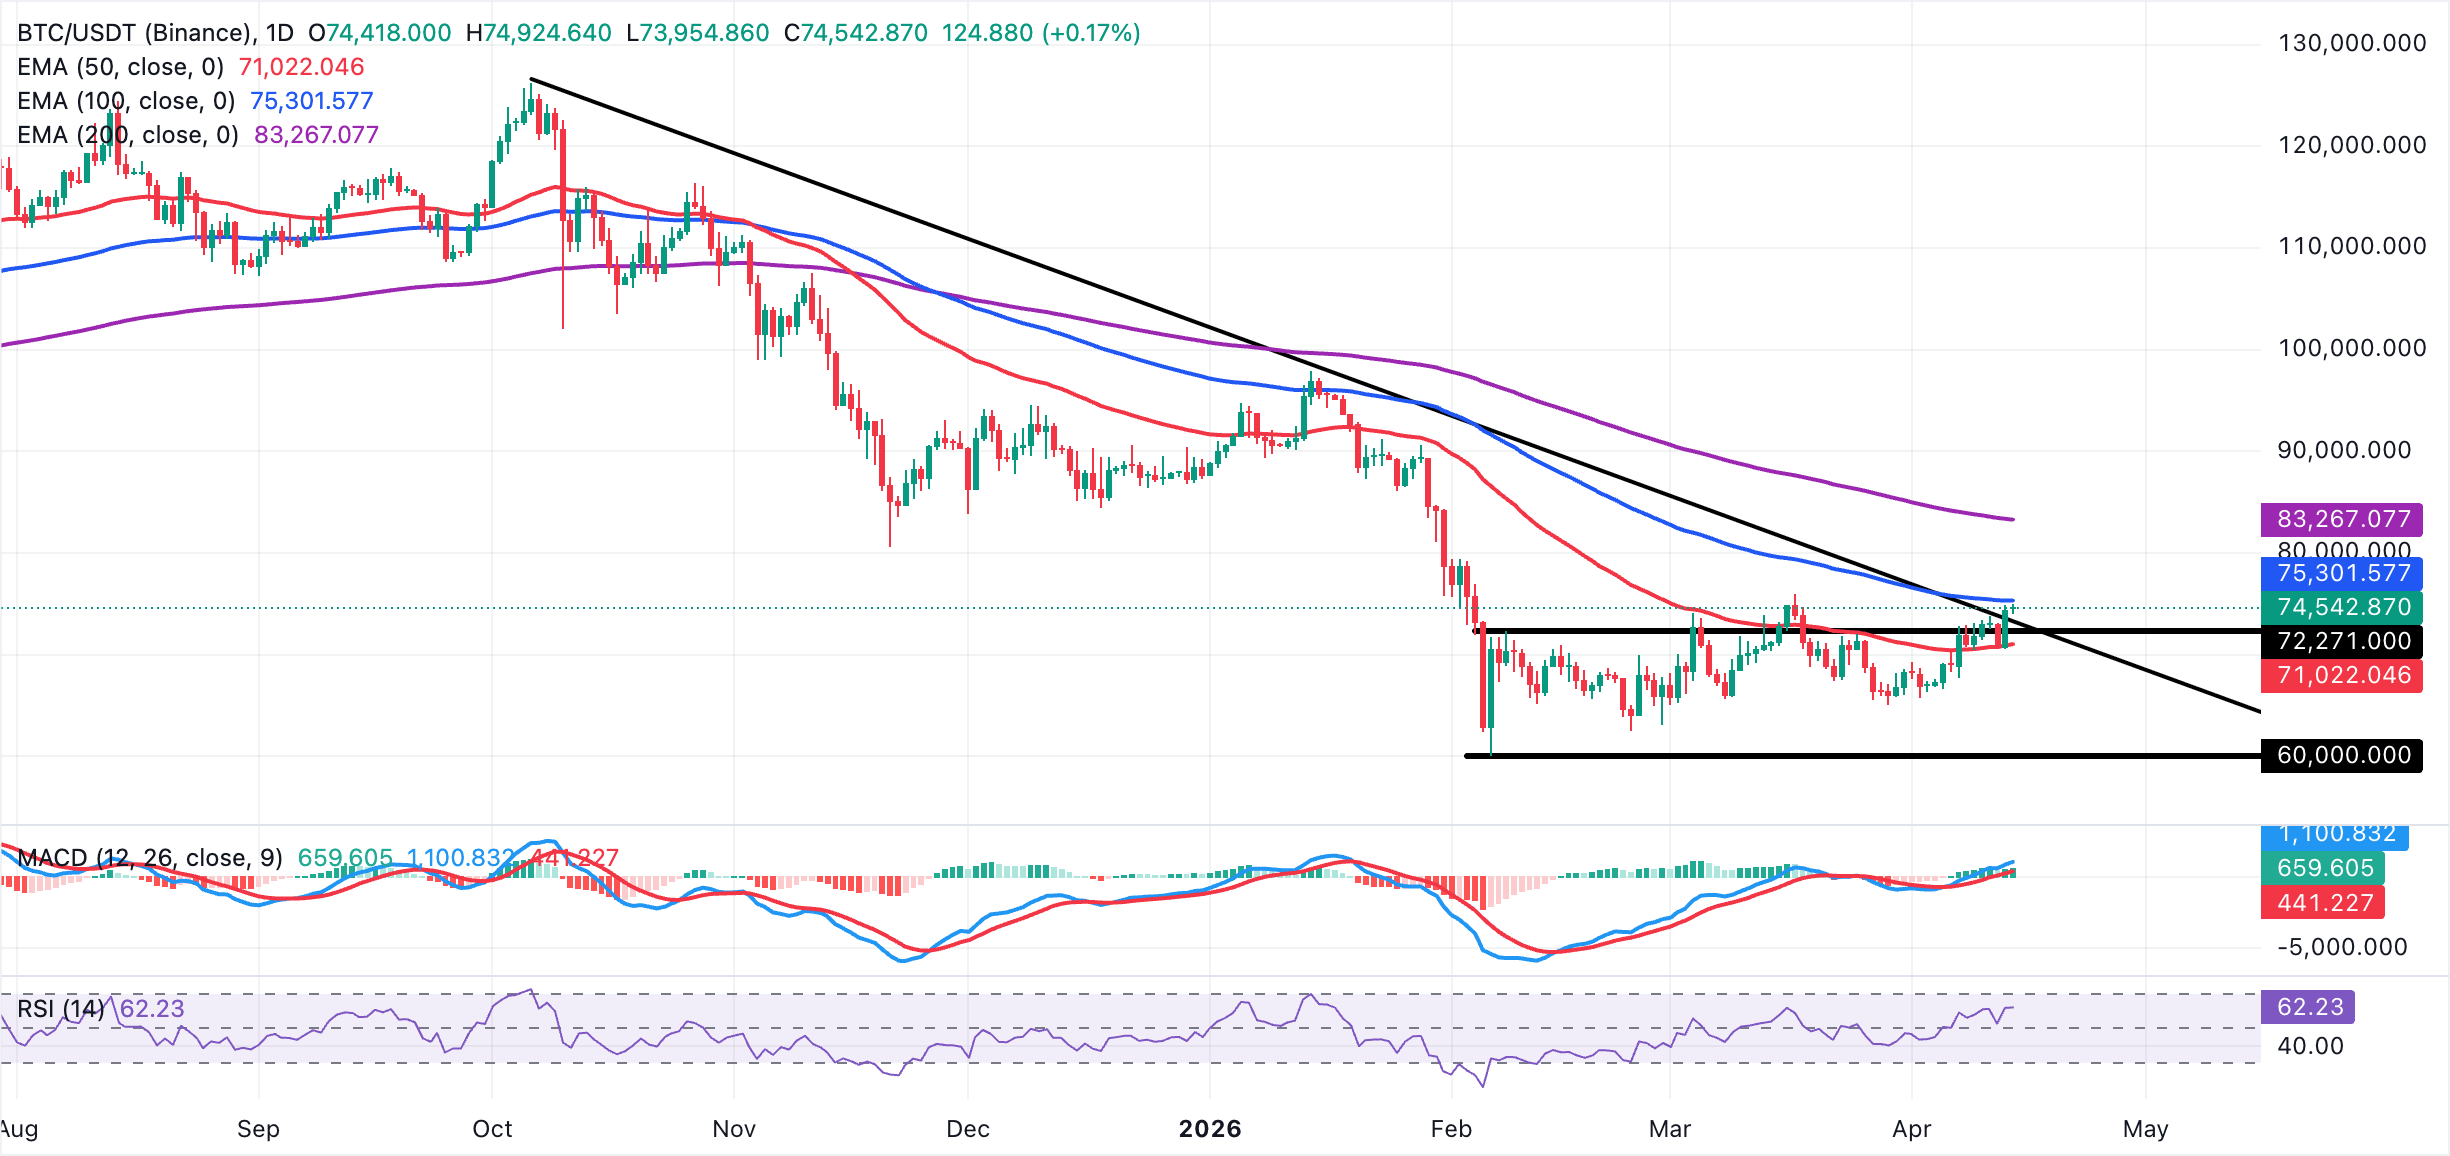
On the topside, Bitcoin's immediate resistance is at the 100-day EMA near $75,300, followed by the March peak at $76,000, then the 200-day EMA at $83,267, which defines a broader cap on the advance. On the downside, initial support now lies at the reclaimed trendline area around $73,168, ahead of the 50-day EMA at $71,022, where a deeper pullback would be expected to attract dip-buying interest as long as the broader bullish structure remains intact.
Altcoins technical outlook: Ethereum strengthens recovery while XRP upside stays limited
Ethereum trades at $2,378, holding a constructive near-term bullish bias as price remains above the 50-day and 100-day EMAs at roughly $2,178 and $2,357, respectively. The reclaimed downward trendline break area around $2,301 now underpins the advance, while the 200-day EMA near $2,673 stays well overhead as the next major trend barrier.
The upward momentum aligns with the bullish tone, as reflected by the RSI hovering in the mid-60s on the daily chart and the MACD indicator remaining positive and advancing, suggesting buyers retain control for now.
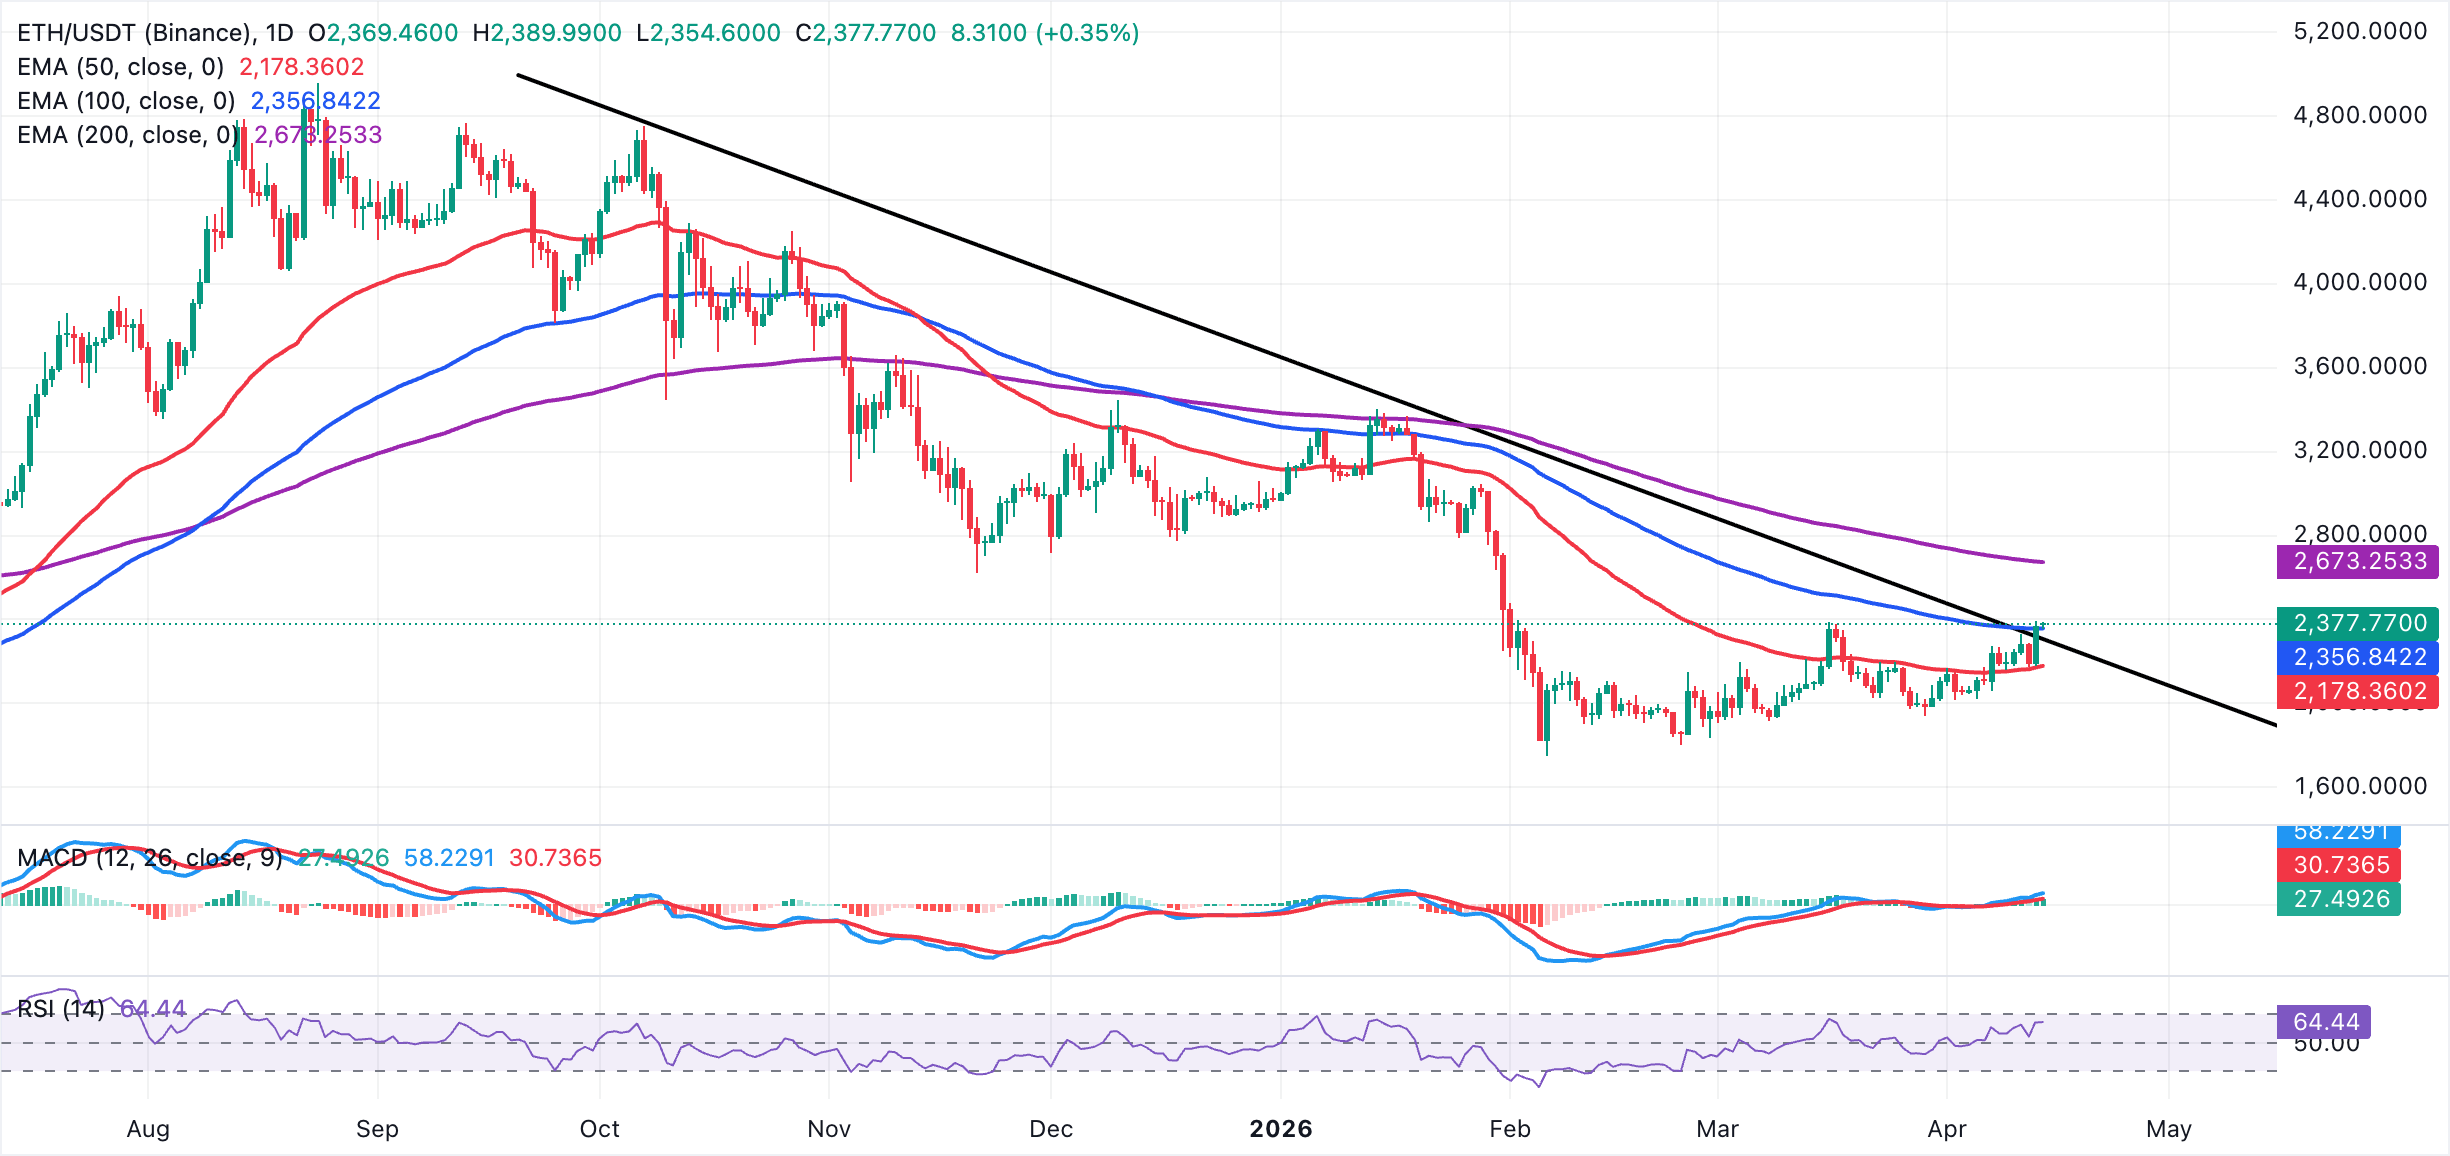
On the downside, ETH's immediate support is seen first at the 100-day EMA around $2,357, followed by the former breakout region near $2,301, with the 50-day EMA at $2,178 reinforcing the broader underlying demand zone on deeper pullbacks. On the topside, the 200-day EMA at $2,673 highlights the key resistance. A sustained move above this long-term average would strengthen the bullish outlook and open the door to a more extended recovery phase.
On the other hand, XRP trades around $1.37, keeping a bearish near-term bias as price holds beneath all major moving averages. The 50-day EMA at $1.41 is the first cap overhead, with the 100-day EMA at $1.56 and the long-term 200-day EMA at $1.81 reinforcing a broader downside tone. The remittance token remains entrenched below this moving-average stack.
The MACD histogram has turned modestly positive, and the indicator is marginally above its signal line, hinting at improving momentum, but this has yet to meaningfully challenge the prevailing downside structure.
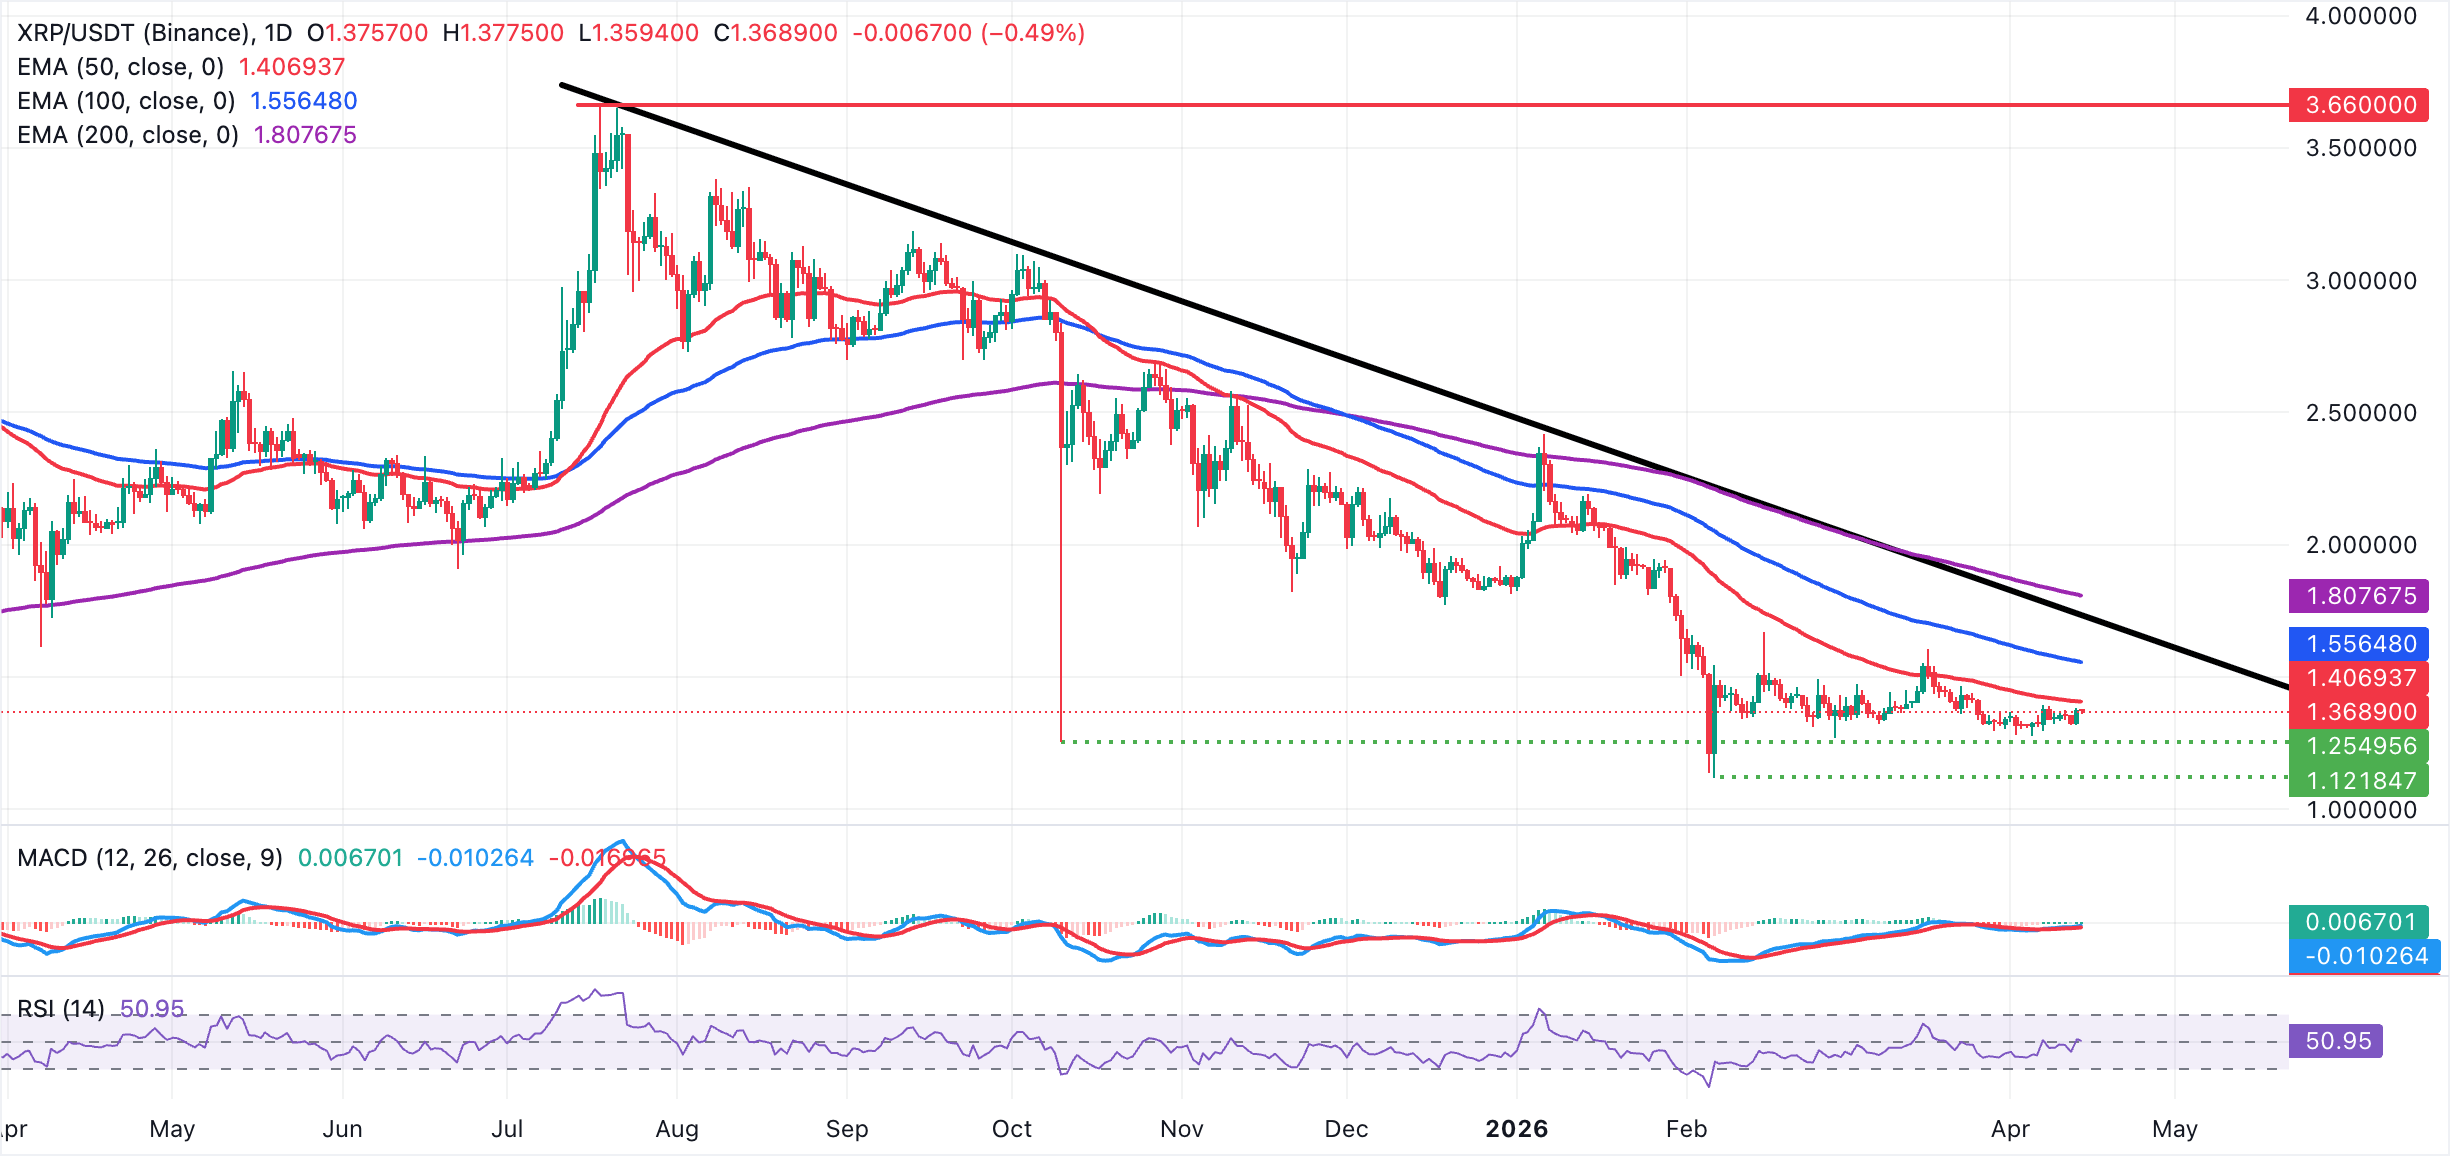
On the topside, XRP's initial resistance lies at the 50-day EMA around $1.41, followed by the 100-day EMA near $1.56. A more decisive recovery would require a daily close above the downward resistance trendline break region near $1.73 and ultimately the 200-day EMA at roughly $1.81 to ease the broader bearish pressure.
On the downside, the lack of nearby demand zones leaves XRP vulnerable to further correction, with short-term direction likely to be dictated by how the market reacts to the $1.40 region and the ability or failure of buyers to reclaim the 50-day EMA as support.
Open Interest, funding rate FAQs
Higher Open Interest is associated with higher liquidity and new capital inflow to the market. This is considered the equivalent of increase in efficiency and the ongoing trend continues. When Open Interest decreases, it is considered a sign of liquidation in the market, investors are leaving and the overall demand for an asset is on a decline, fueling a bearish sentiment among investors.
Funding fees bridge the difference between spot prices and prices of futures contracts of an asset by increasing liquidation risks faced by traders. A consistently high and positive funding rate implies there is a bullish sentiment among market participants and there is an expectation of a price hike. A consistently negative funding rate for an asset implies a bearish sentiment, indicating that traders expect the cryptocurrency’s price to fall and a bearish trend reversal is likely to occur.
(The technical analysis of this story was written with the help of an AI tool.)
Recommended Articles









Comments (0)
Click the $ button, enter the symbol, and select to link a stock, ETF, or other ticker.