


Hyperliquid Price Forecast: Bullish flows extend rally toward key resistance



- Hyperliquid extends its gains on Tuesday after surging by more than 8% the previous day.
- On-chain and derivatives support bullish sentiment, as buy-side dominance, open interest and long bets are rising.
- The technical outlook suggests further gains, targeting $50 HYPE.
Hyperliquid (HYPE) price extends its gains, trading above $44 as of Tuesday, after surging over 8% in the previous day. Strengthening on-chain data and improved derivatives metrics support a bullish outlook, while technical analysis points to further gains toward the $50 mark.
Bullish on-chain and derivatives outlook
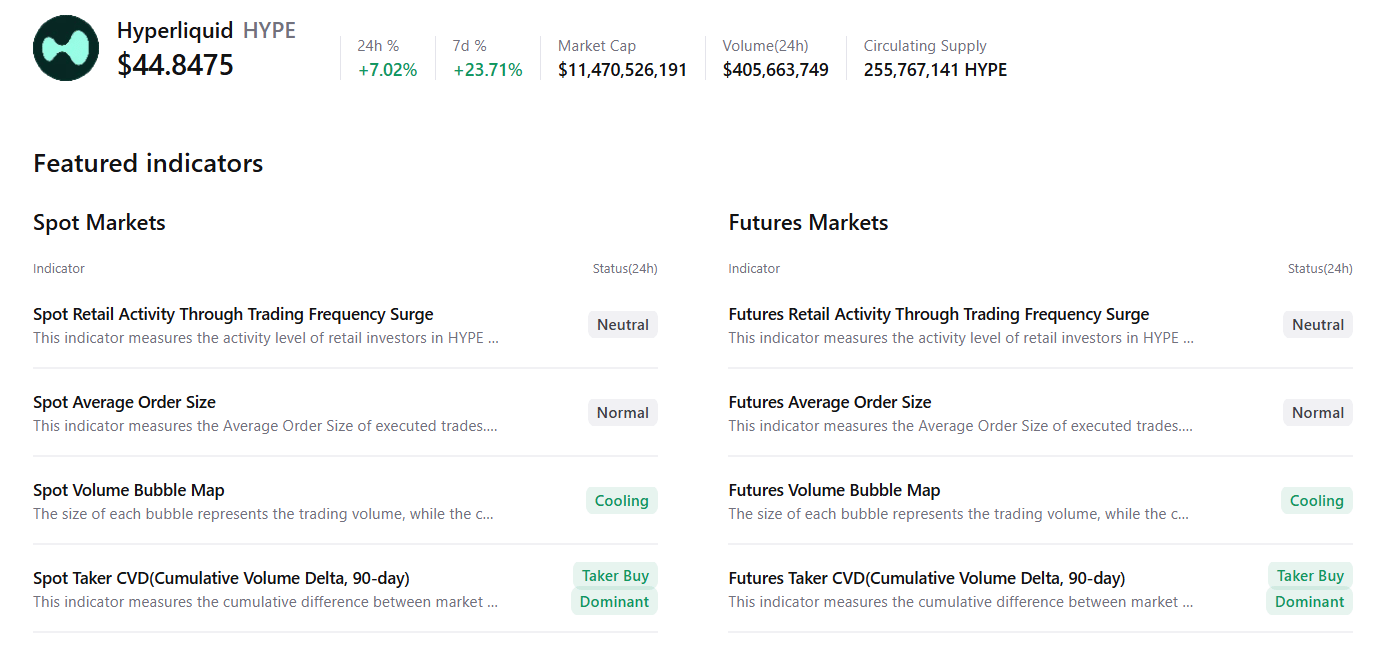
CryptoQuant summary data suggests a bullish outlook. Hyperliquid’s spot and futures markets show buy-side dominance and cooling conditions, with mostly neutral conditions across other metrics, suggesting a potential upside move.
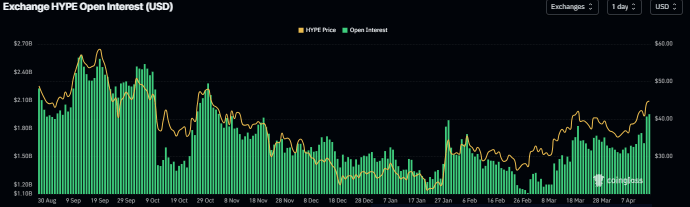
On the derivatives side, CoinGlass data shows that the futures’ Open Interest (OI) at exchanges in HYPE reached $1.95 billion on Tuesday, up from $1.5 billion on April 3, and has been rising steadily, reaching the highest level in early November. An increasing OI indicates new or additional money entering the market and new buying, which could fuel a rally in HYPE price.
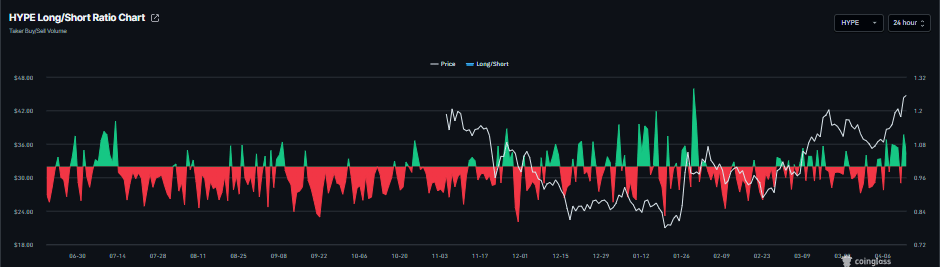
In addition, CoinGlass’ long-to-short ratio for HYPE reads 1.04 on Tuesday. This ratio, being above one, reflects bullish sentiment in the market, as more traders are betting on the asset’s price to rally.
Hyperliquid Price Forecast: HYPE bulls target $50 mark
Hyperliquid’s price is extending gains, trading above $44 on Tuesday after rallying 8.37% and surpassing the March high of $43.75 the previous day.
If HYPE continues its upward trend, it could extend the rally toward the October 30 high of $50.15.
The Relative Strength Index (RSI) on the daily chart is 69, pointing upward toward the overbought conditions, indicating strong bullish momentum. The Moving Average Convergence Divergence (MACD) indicator on the same chart showed a bullish crossover on April 10, which remains intact, supporting a positive outlook.
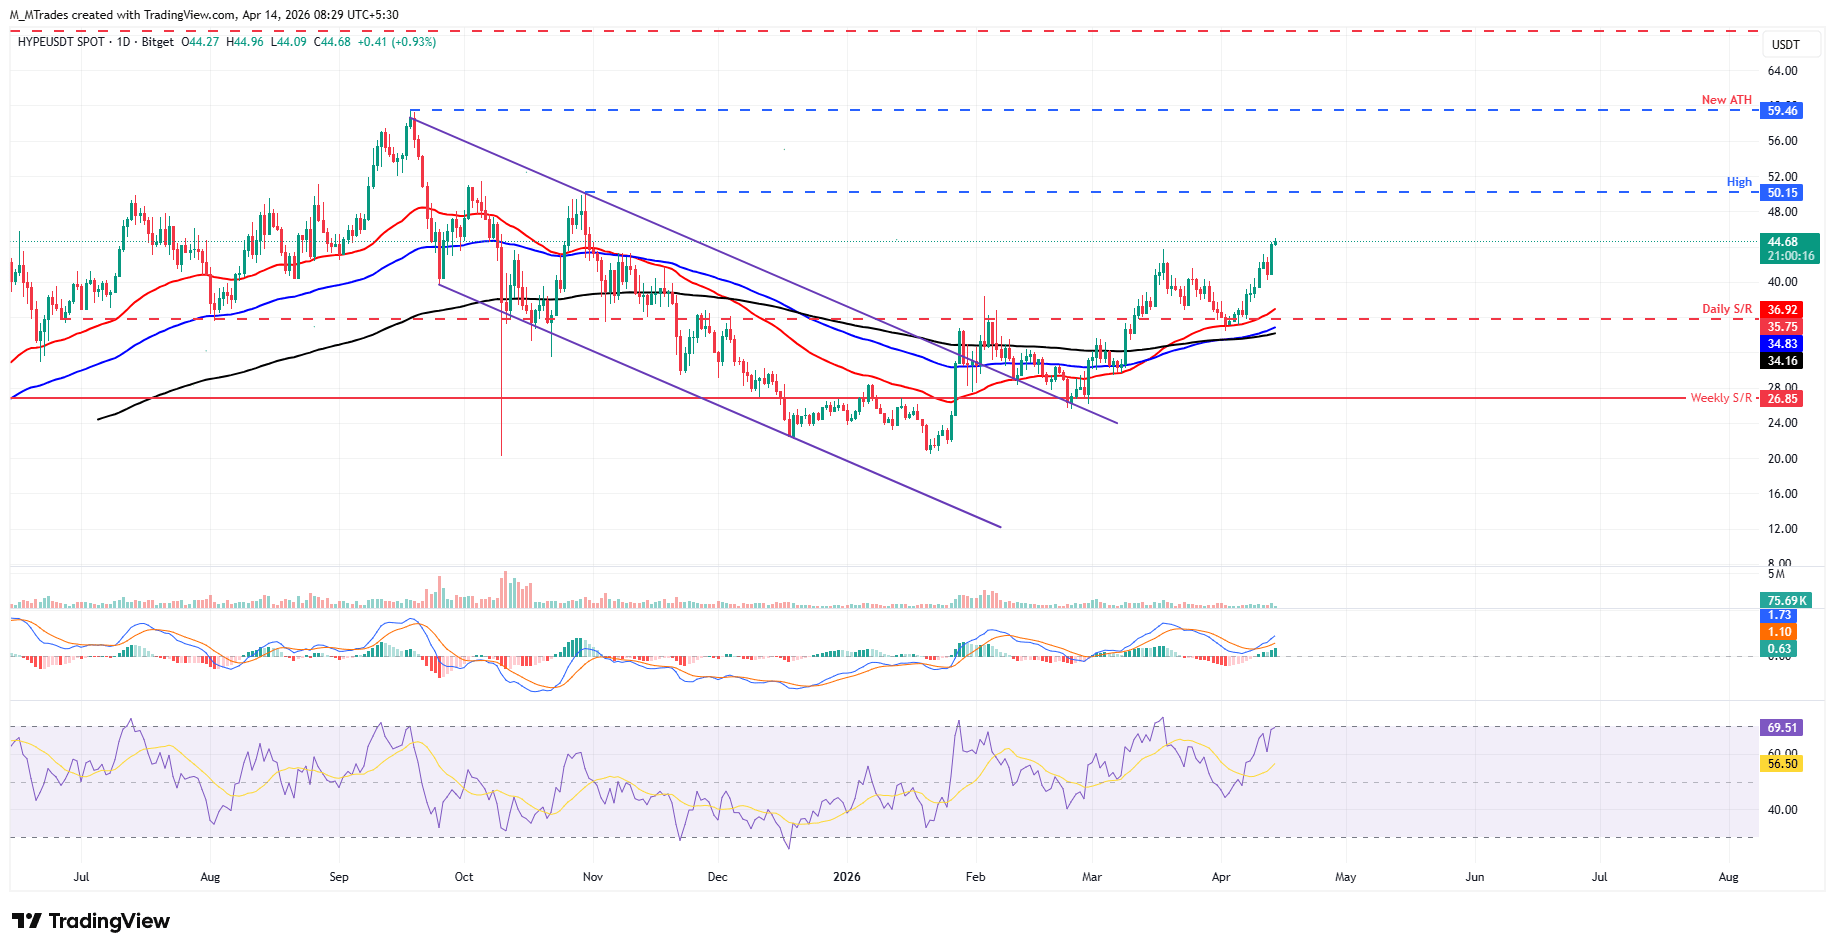
If HYPE faces a correction, it could find support near the psychological level of $40.
Recommended Articles









Comments (0)
Click the $ button, enter the symbol, and select to link a stock, ETF, or other ticker.