


Ondo Price Forecast: Bearish setup persists as futures positioning turns risk-off



- Ondo nears $0.2500 on Thursday after a roughly 5% drop the previous day.
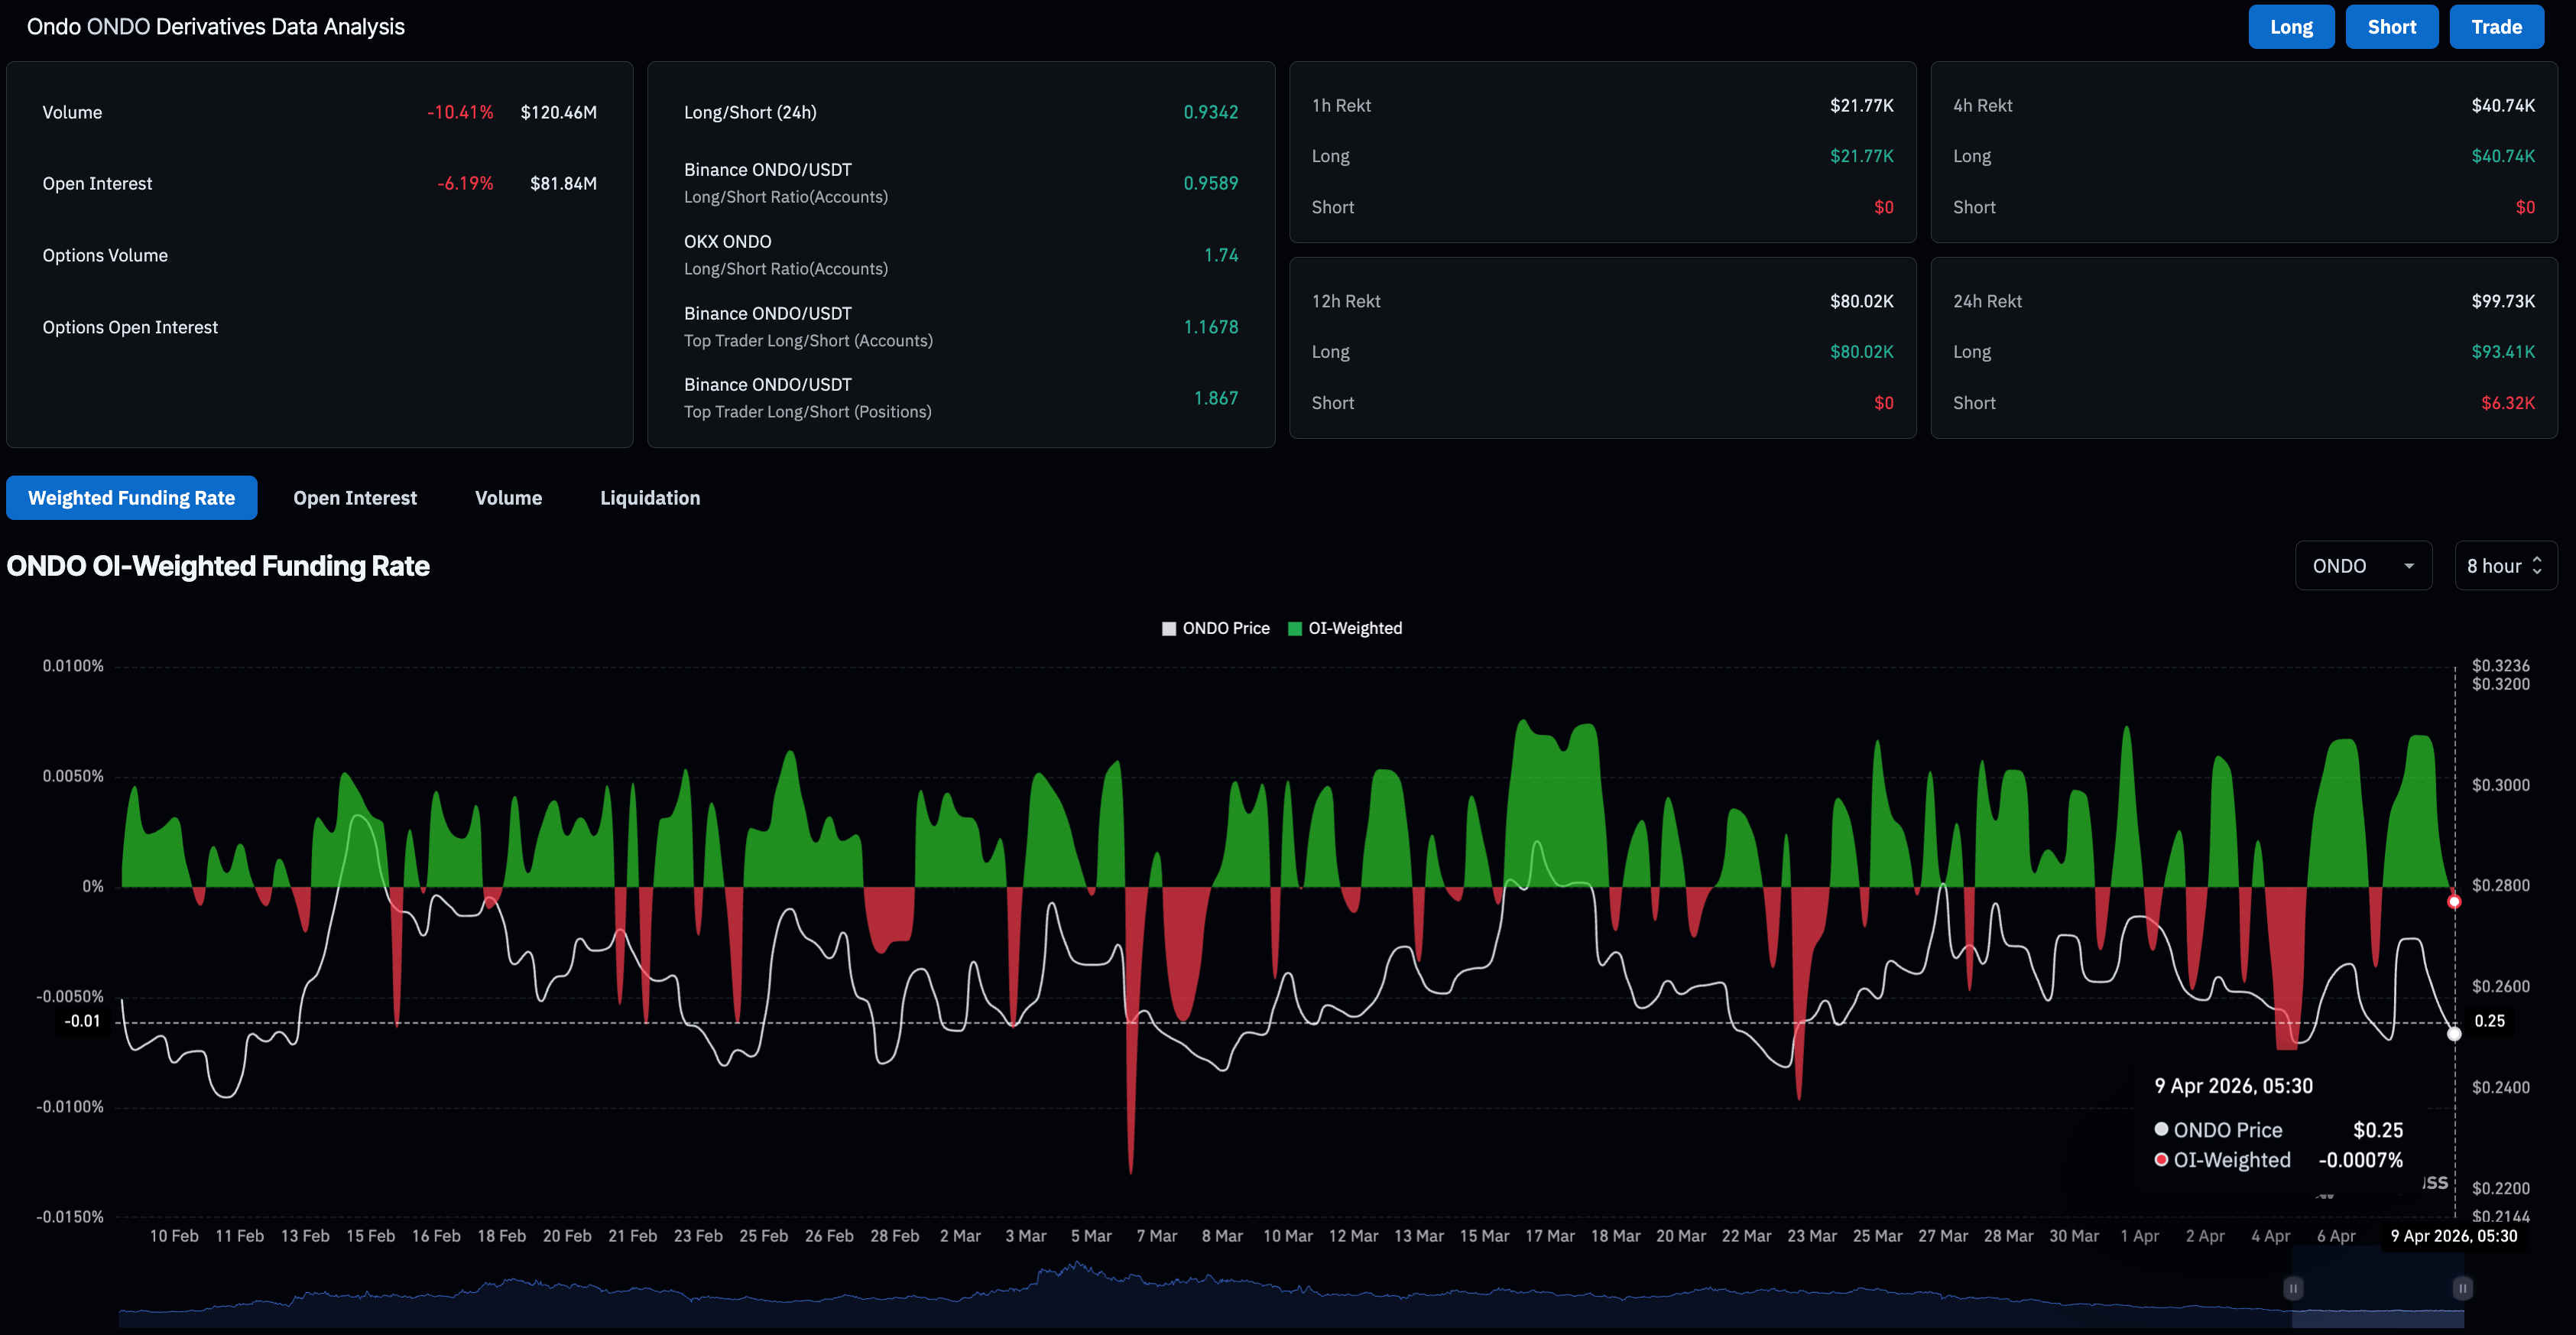
- The futures market exhibits a risk-off sentiment as Open Interest declines and funding rates turn negative.
- The technical outlook is mildly bearish, focusing on a potential breakdown of the key support level.
Ondo (ONDO) is facing downside pressure at press time on Thursday, threatening the $0.2400 support level. The derivatives market is leaning bearish on ONDO, with futures Open Interest dropping amid intense long liquidations. Technically, the real-world asset tokenization-focused (RWA) crypto is losing ground and risks further correction.
Bearish bets are weighing down on ONDO futures
The leverage market anticipates further declines in ONDO amid incredulity over the US-Iran ceasefire, weighing on the broader cryptocurrency market. According to CoinGlass, the ONDO futures recorded a total liquidation of $99,730 over the last 24 hours, led by $93,410 in long liquidations, indicating an intense sell-side pressure in the spot market.
The sharp liquidation led to a 6% decline in the ONDO futures Open Interest (OI) to $81.84 million over the same period, indicating reduced market participation. Additionally, the funding rate dropped to -0.0007% and the long-to-short ratio to 0.9342, both of which suggest a bearish inclination among traders.
Downside pressure on Ondo risks bearish breakdown
ONDO trades around $0.2500 at press time on Thursday after a 5% drop from the 50-day Exponential Moving Average (EMA) at $0.2700 the previous day. Meanwhile, the 100-day EMA at $0.3186 and the 200-day EMA at $0.4420 remain well above the market, reinforcing a broader downside-skewed structure.
The 50-day EMA at $0.2700 is the first cap on the upside, followed by the $0.2968 ceiling.
Momentum aligns with this tone, as the Relative Strength Index (RSI) at 44 remains below the 50 midline, and the Moving Average Convergence Divergence (MACD) indicator prints a negative reading below zero, hinting at persistent selling pressure rather than an imminent reversal.
On the downside, the February 9 and February 6 lows at $0.2405 and $0.2018, respectively, are key support levels. However, a drop below the $0.2000 psychological level would significantly increase the downside risk.
(The technical analysis of this story was written with the help of an AI tool.)
Recommended Articles









Comments (0)
Click the $ button, enter the symbol, and select to link a stock, ETF, or other ticker.