


Avalanche Price Forecast: AVAX extends correction as derivatives and technicals reinforce bearish outlook



- Avalanche price extends its correction on Tuesday after falling nearly 2% the previous day.
- Derivatives data back a bearish sentiment with negative funding rates and rising short bets among traders.
- The technical outlook suggests a deeper correction, as momentum indicators signal a bearish bias.
Avalanche (AVAX) price slips below $9 as of writing on Tuesday after correcting slightly the previous day. Weakening derivatives metrics, alongside bearish technical price action, suggest a deeper correction for AVAX in the coming days.
Bearish sentiment among Avalanche traders
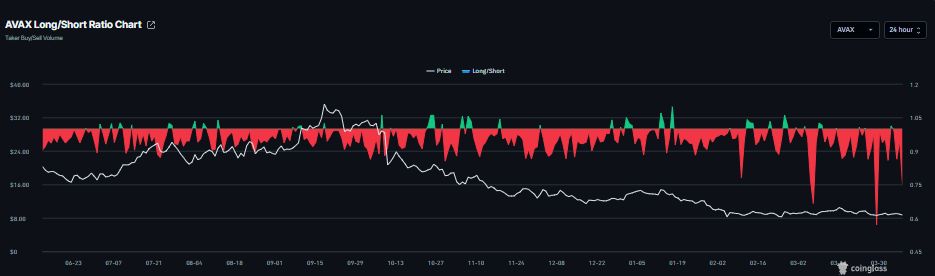
CoinGlass’s AVAX long-to-short ratio is currently at 0.75 on Tuesday, nearing its lowest level over a month. This ratio is below 1, reflecting bearish sentiment in the markets, as more traders are betting the asset’s price will fall.
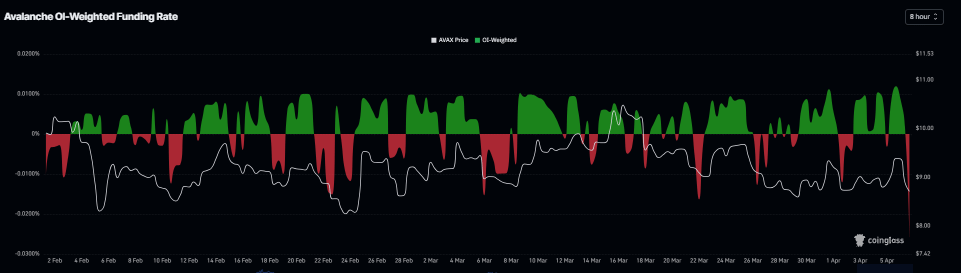
In addition, funding rate data also point to a bearish outlook for Avalanche. The metric flipped to a negative rate on Monday, reading -0.025% on Tuesday, indicating shorts are paying longs and suggesting bearish sentiment toward AVAX.
Avalanche Price Forecast: AVAX is set for a deeper correction
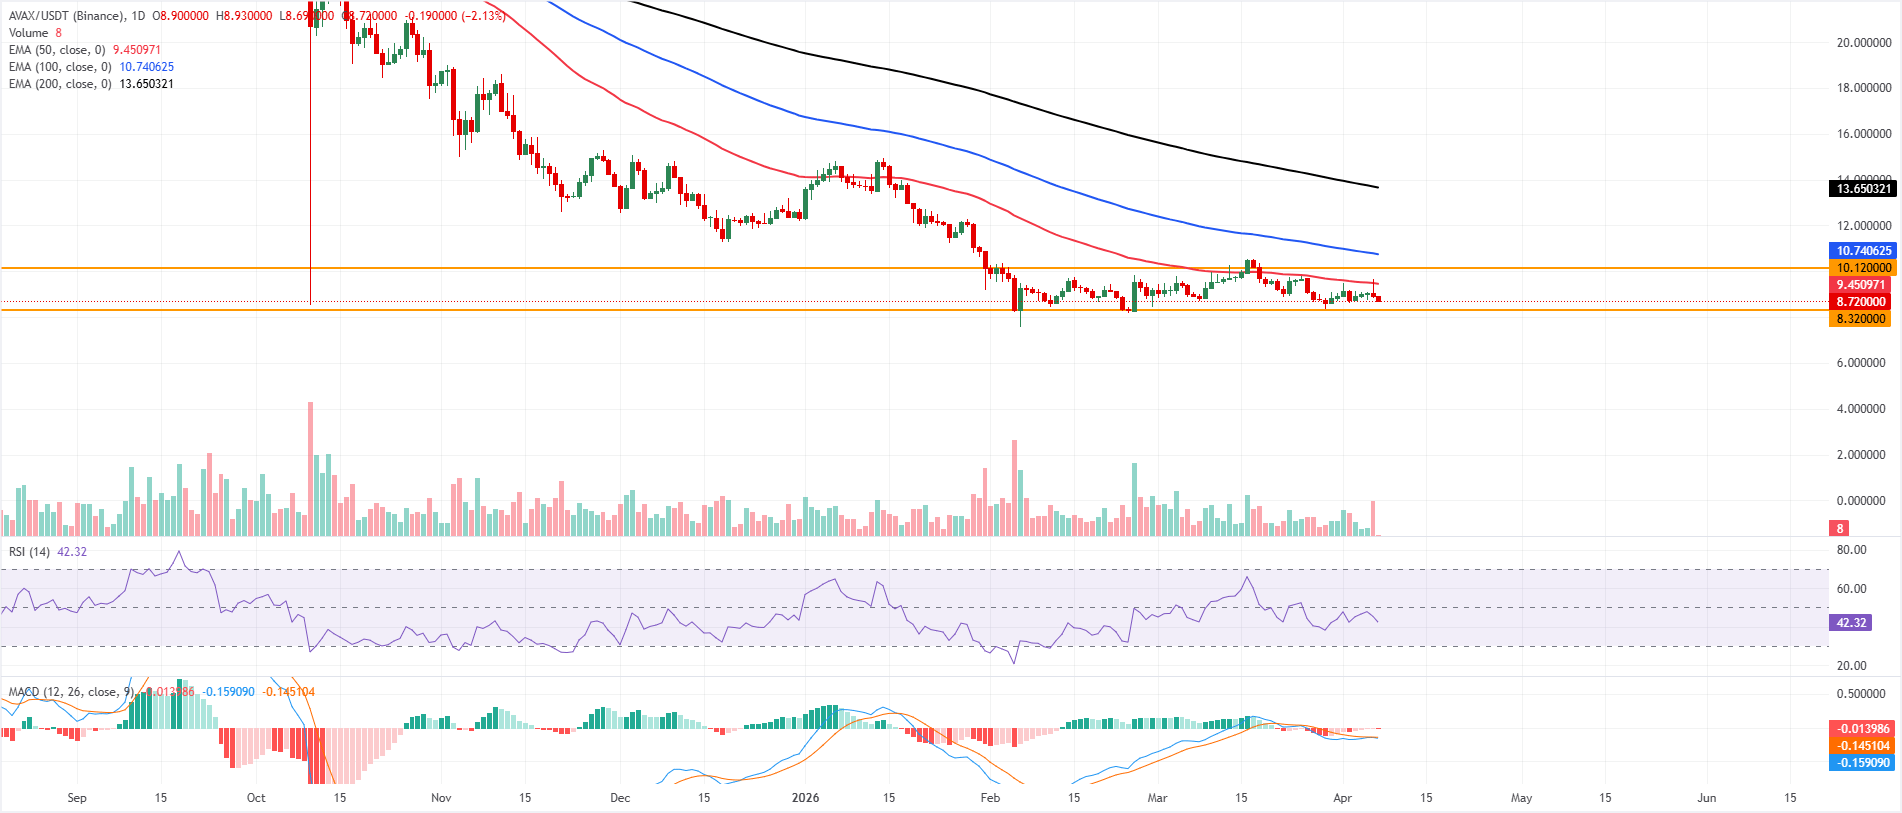
Avalanche price is trading below $9 on Tuesday after falling slightly the previous day. The near-term bias stays mildly bearish as price slips beneath the 50-day Exponential Moving Average while all key averages remain clustered well above spot, preserving a broader downward context.
The Relative Strength Index (RSI) at 42 leans to the downside but avoids oversold territory, matching a controlled drift lower rather than capitulation. The Moving Average Convergence Divergence (MACD) line holds below its signal line and the zero line, with a modest negative histogram, reinforcing persistent but not accelerating bearish momentum.
Immediate resistance emerges near $9.45, where the 50-day EMA converges with recent swing highs, ahead of the horizontal barrier at $10.12 that guards any attempt to re-establish a stronger recovery.
On the downside, initial support stands at $8.60, just above the charted horizontal level at $8.32, which marks the next key floor if selling extends. A daily close below $8.32 would expose lower levels in the broader downtrend, while a recovery above $9.45 would ease immediate pressure and open the path toward a test of $10.12.
(The technical analysis of this story was written with the help of an AI tool.)
Recommended Articles









Comments (0)
Click the $ button, enter the symbol, and select to link a stock, ETF, or other ticker.