


Is A New XRP Price Record Imminent? Analyst Forecast Colossal Short Squeeze Ahead



A significant short squeeze may be on the horizon for XRP investors, potentially serving as the main catalyst for a rally that could push prices beyond the all-time high of $3.90.
Market analyst Bird made these predictions in a recent post on social media platform X (formerly Twitter), highlighting key observations from his analysis.
Key Liquidity Zones For XRP
Bird shared a chart that illustrates where leveraged positions—both long and short—are concentrated in the market. He explained that the colored bands on the chart indicate levels of liquidity, where the potential for forced buying or selling could occur due to stop-loss orders and liquidations.
The analysis of the altcoin’s daily chart heatmap categorizes liquidity into two distinct zones: red, signifying deep liquidity, and lighter colors indicating less liquidity.
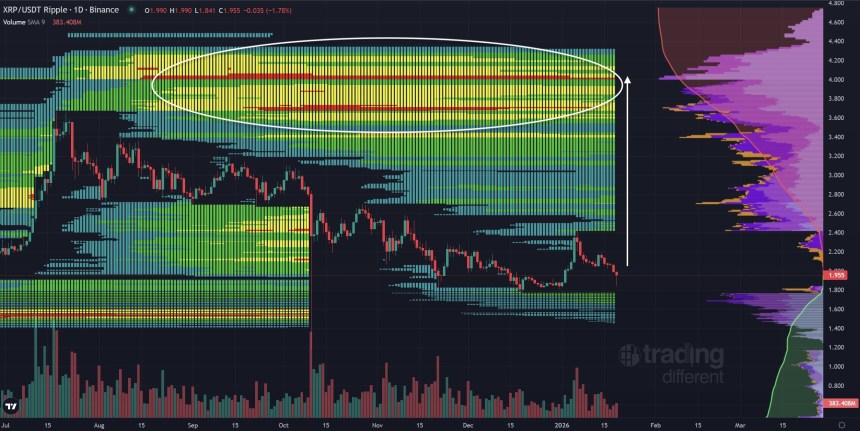
From his observations, Bird noted that price movements away from low liquidity areas tend to occur rapidly. He explained this process: when prices approach zones with significant stop-loss clusters, they often trigger large sell-offs, wiping out long positions.
Price Targets $4.20
Following these movements, the price typically rotates back toward shorts, leading to additional liquidation events. Bird pointed out that on Sunday, a number of long XRP positions were liquidated.
Now, he sees a dense liquidity pocket forming around the $4.20 mark, primarily from short XRP positions. This situation incentivizes market makers to drive prices toward this liquidity to close out those trades, rather than moving away from it.
As a result, Bird expressed confidence that the current XRP price rally is far from over. He believes that a new all-time high is imminent, as the potential for a substantial short squeeze looms.
At the time of writing, the fifth-largest cryptocurrency on the market was trading at $2, having briefly dropped to $1.84 earlier on Monday.
Featured image from DALL-E, chart from TradingView.com
Recommended Articles








Comments (0)
Click the $ button, enter the symbol, and select to link a stock, ETF, or other ticker.