


Bitcoin Buyers Step Back After Failed Push Beyond $115,000: Data



Bitcoin traded listlessly as September wraps up, caught inside a tight price band and showing signs of weakening momentum.
Based on reports using CryptoQuant data and commentary by Axel Adler, demand cooled after the market failed to hold above $115,000, leaving traders watching a narrow corridor for the next move. The mood is neither euphoric nor panicked — it is cautious.
Mounting Pressure At Descending Highs
Over the past week Bitcoin swung between a local high near $115,550 and a low around $108,400. For the last sessions it settled into an even tighter $108,750–109,740 band. Sellers stepped in at lower highs, keeping the price from climbing back to the prior range.
According to Adler, those descending highs are a warning sign because they show buyers are losing early ground. Immediate resistance sits around $111,000–112,000, based on on-chain flows and exchange behavior.
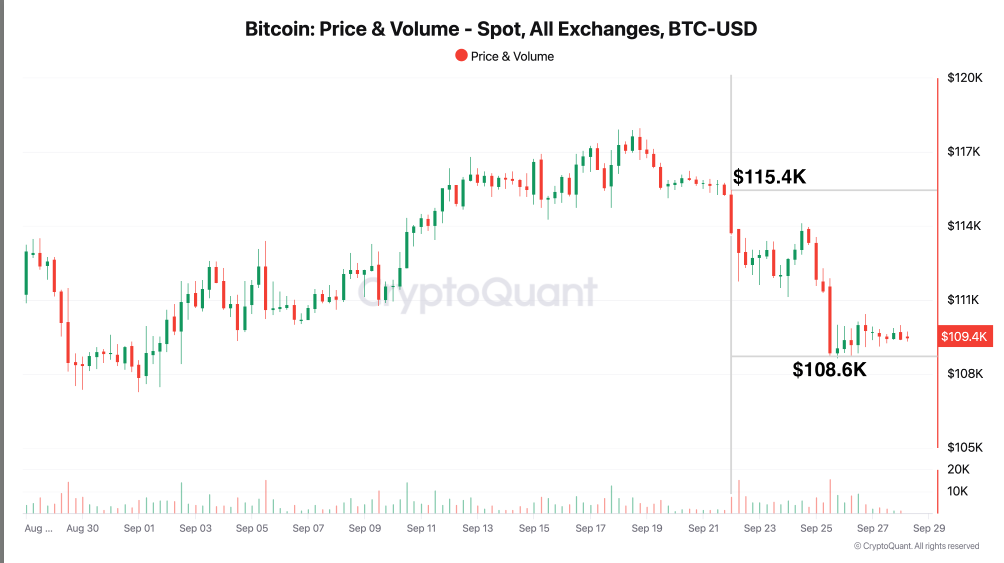
Move past that and bulls could try to retake $114,000–115,400. Fail to defend $108,750 and the path down may quicken toward $106,000–105,000.
Momentum Has Turned Cautious
CryptoQuant’s 30-day momentum index finished the week near -2%, down from +1% at the start, a swing of three percentage points. Momentum readings this period ranged from -6% to +1%, and only two of seven sessions closed above zero.
Those figures underline how the loss of the $114,000–115,000 support coincided with falling buying pressure. Traders often look for sustained positive momentum to confirm a rally. According to Adler, a clear recovery would need a return above $112K and several days of positive momentum to shift the tone back toward an uptrend.
The current pattern is a classic consolidation after a failed breakout. Buyers tried and failed to keep prices north of $115,000, and that shortfall left the market in a neutral-to-bearish stance.
Reports have disclosed that the week’s range and the momentum slide make an immediate strong advance unlikely without fresh demand. At the same time, there is no sign of a full-scale sell-off. Liquidity remains present near established supports.
Key Levels To WatchA decisive push above the $111,000–112,000 resistance band could prompt a test of $114,000–115,400. The $108,600 base remains a key level. A break below it without a swift rebound could open the way toward stronger support between $106,000 and $105,000.
Shifts in on-chain demand and exchange flows are expected to provide clearer signals, as price action alone may appear steady while underlying activity changes.
Featured image from Gemini, chart from TradingView
Recommended Articles








Comments (0)
Click the $ button, enter the symbol, and select to link a stock, ETF, or other ticker.