


Here’s How High The Bitcoin Price Will Go If It Repeats The 2017 Cycle



The Bitcoin bull cycles have always been similar in the fact that each one has always ended with the Bitcoin price multiples higher than the previous high. While the digital asset has hit new all-time highs this cycle, it is far from being multiples of the previous all-time high, and has yet to hit the 2x mark. However, with a lot of similarities popping up between this cycle and what was seen in 2017, there is still the possibility that the Bitcoin price will run higher from here.
Bitcoin Price Mirroring 2021 Cycle Moves
Crypto analyst Merlijn The Trader took to X (formerly Twitter) to share some similarities that they noticed between the current Bitcoin price trend and what was recorded back in 2017. Putting both charts side by side, the crypto analyst pointed out the ways in which the two cycles have performed similarly.
One of the first things is how the bear market ended, which is highlighted by the red box in the shared charts. After some choppy movement, the bear market would come to an end with an initial breakout. This was followed by a short retracement, leading to the next step in the trend.
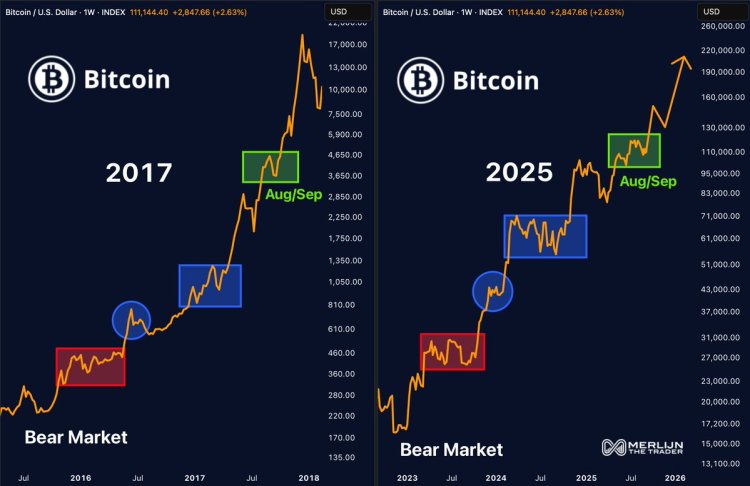
The next box, the blue box, is the level of accumulation. This is where Bitcoin investors had loaded up their bags in anticipation of an upward move. Naturally, the accumulation lasted for a number of months before it was complete, and the breakout occurred.
The third box is the green box, and the crypto analyst explains that this is the level that “launched portfolios.” Back in 2017, after the green box, the Bitcoin price rose rapidly and more than doubled by the time the rally was done, and with the current trend sitting in the green box, it carries some hefty bullish implications for the Bitcoin price.
How High Can BTC Go From Here?
Seeing how the Bitcoin price is mirroring the 2017 trend so far, it is likely to continue to play out in a similar way. From the green box, the price doubling like it did would mean that Bitcoin would end up crossing the $200,000 mark from here.
The crypto analyst’s chart points toward the $220,000 mark, with some dips along the way that are expected to be eaten up quickly. The timeframe also seems similar, and if the trend holds, then this could play out in the next 3 months, leading into the year 2026.
Recommended Articles








Comments (0)
Click the $ button, enter the symbol, and select to link a stock, ETF, or other ticker.