


Bitcoin Dives As On-Chain Data Shows Every Cohort Now Selling



On-chain data shows all Bitcoin investor cohorts have pivoted to distribution recently, an indication that a shift in market mood has occurred.
Bitcoin Accumulation Trend Score Has Turned Red For All Holders
In a new post on X, on-chain analytics firm Glassnode has talked about the latest trend in the Accumulation Trend Score of Bitcoin for the various investor cohorts. The Accumulation Trend Score measures, as its name suggests, the degree of accumulation or distribution that BTC holders are participating in.
The indicator uses two factors to calculate the score: the balance changes happening in the wallets of the investors and the size of the wallets involved. This means that larger entities have a higher influence on the indicator.
Now, here is a the chart shared by Glassnode that shows the trend in the Bitcoin Accumulation Trend Score across holder groups over the past year:
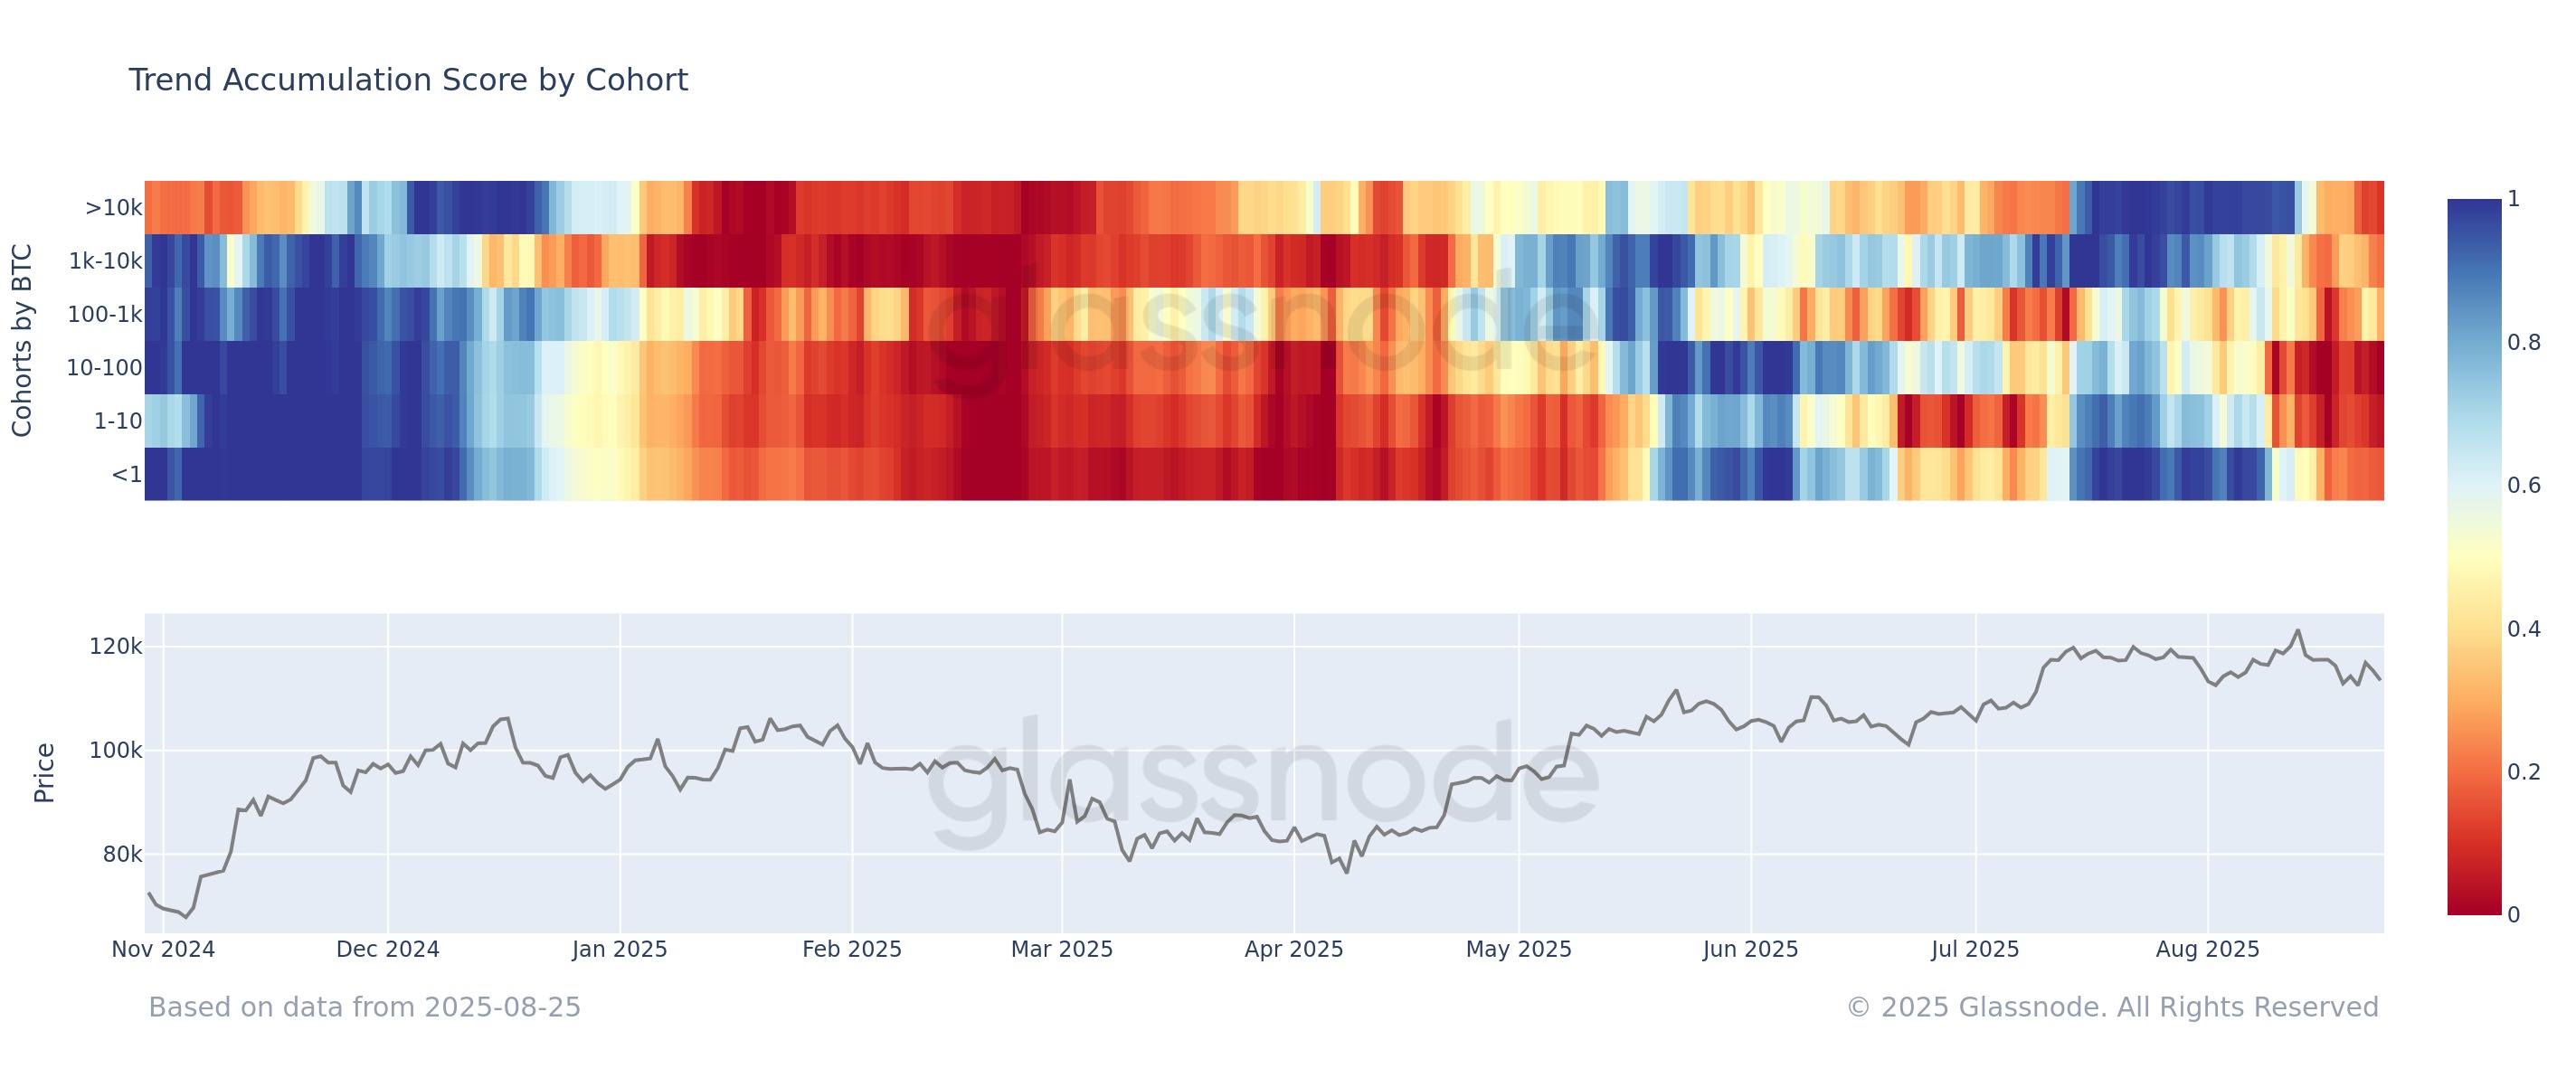
As displayed in the above graph, the Bitcoin Accumulation Trend Score had a value greater than 0.5 for all investor groups back in July, implying a net accumulation behavior across the cohorts.
Retail (under 1 BTC), whales (1,000 to 10,000 BTC), and mega whales (above 10,000 BTC) even saw the metric assume a value close to 1 for a while, which corresponds to a near-perfect accumulation trend.
Earlier this month, the market buying started to show signs of weakness and now, the behavior has flipped across the holder groups with investors taking to distribution. Fish (10 to 100 BTC) lead the selling with an Accumulation Trend Score near zero.
“The uniformity across cohorts highlights broad sell-side pressure emerging in the market,” notes the analytics firm. From the chart, it’s visible that the last time this pattern developed was in January. What followed the sector-wide selloff was a bearish period for Bitcoin.
As such, it now remains to be seen whether the recent shift toward distribution would also lead to something similar. Another development that could potentially signal the oncoming of a bearish phase could be BTC’s retest of the Realized Price of the 1 month to 3 months old investors, as Glassnode has explained in another X post.

The Realized Price is a metric that calculates the average cost basis of Bitcoin investors. The metric shown in the above chart tracks this value specifically for the holders who purchased their coins between 1 and 3 months ago.
At present, the indicator is sitting at $110,800, which is around where BTC has been trading following its decline. “Historically, failure to hold above this level has often led to multi-month market weakness and potential deeper corrections,” says the analytics firm.
BTC Price
At the time of writing, Bitcoin is floating around $109,900, down more than 5% over the last seven days.
Recommended Articles









Comments (0)
Click the $ button, enter the symbol, and select to link a stock, ETF, or other ticker.