


Bitcoin MVRV Ratio Forms Bear Cross—Brace For Impact?



On-chain data shows the Bitcoin Market Value to Realized Value (MVRV) Ratio has formed a cross that may be considered a bearish signal.
Bitcoin MVRV Ratio Has Declined Under 200-Day SMA Recently
As pointed out by analyst Ali Martinez in a new post on X, the Bitcoin MVRV Ratio has crossed below its 200-day simple moving average (SMA) recently. The “MVRV Ratio” refers to an on-chain indicator that measures the ratio between the BTC Market Cap and Realized Cap.
The Realized Cap here is a capitalization model for the cryptocurrency that calculates the total value of the asset’s supply by assuming the ‘real’ value of each individual token to be equal to the spot price at which it was last moved on the blockchain. This model is different from the usual Market Cap, which simply takes the value of all tokens equal to the current spot price.
Since the last transfer of any coin is likely to represent the last time it changed hands, the price at its time could be considered as its current cost basis. As such, the Realized Cap is just a sum of the acquisition price of all tokens in circulation.
One way to interpret the model is as a measure of the total amount of capital that the investors have put into Bitcoin. On the other hand, the Market Cap can be looked at as the value the holders are carrying in the present.
Since the MVRV Ratio compares the two models, it basically tells us about the profit-loss situation of the investors as a whole. Below is the chart shared by the analyst that shows the trend in this indicator, as well as its 200-day SMA, over the past year.
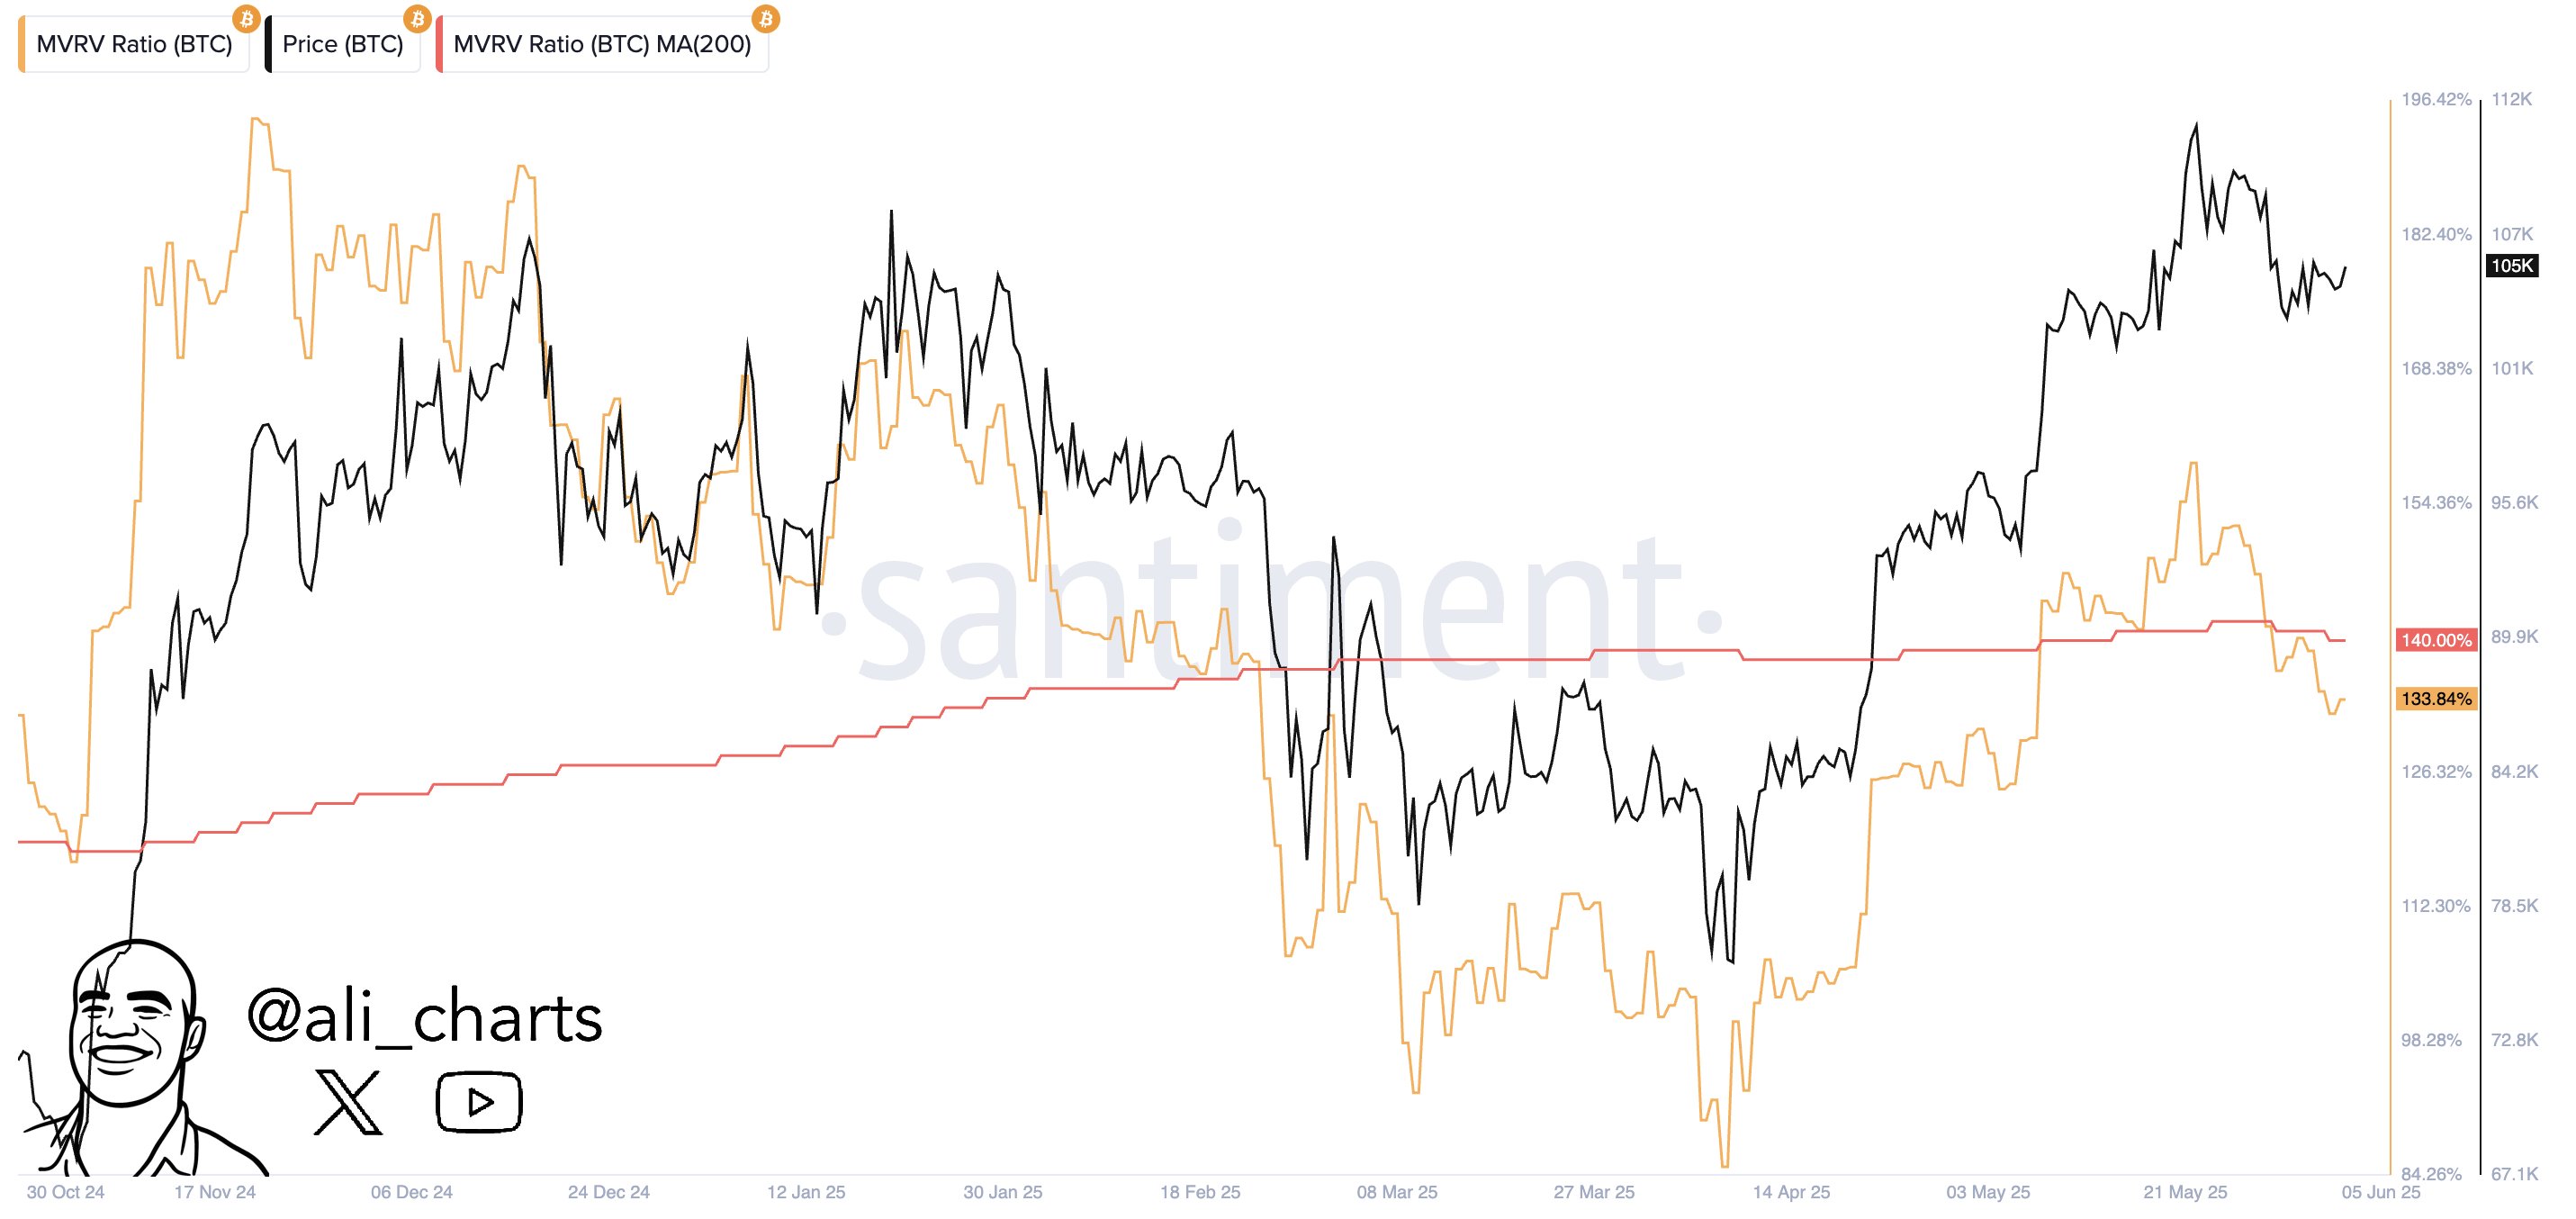
As is visible in the graph, the Bitcoin MVRV Ratio has been notably above the 0% mark recently, which suggests the investors as a whole have been sitting on significant profit.
The metric naturally went up as the asset’s rally earlier took the price to a new all-time high (ATH) and it managed to surpass as 200-day MA. Recently, however, the bearish turn in the coin has meant that the indicator has fallen back under the line.
The last time that the MVRV Ratio dropped below its 200-day SMA was in February. From the chart, it’s apparent that this crossover proved to be bearish for the cryptocurrency.
It now remains to be seen whether this same type of crossover will end up proving another bad omen for Bitcoin or not.
BTC Price
At the time of writing, Bitcoin is trading around $105,000, down 1% in the last week.
Recommended Articles








Comments (0)
Click the $ button, enter the symbol, and select to link a stock, ETF, or other ticker.