


Bitcoin Eyes $97,000-$99,000 As Key Support Zone If Price Decline Persists – Analyst



Bitcoin prices fell by over 3% in the past week as the broader crypto market suffers from a general price correction influenced by macroeconomic pressure. Notably, the premier cryptocurrency now trades above $104,000 representing an estimated 7% decline from its new all-time high at $111,970. Amidst what may yet be a mere correction, market analyst Daan Crypto has highlighted a support zone with strong potentials to halt any further price decline.
$97,000-$99,000 Emerges As Key BTC Price Level
In a brief X post on May 31, Daan Crypto has shared a cautious outlook on Bitcoin amidst an ongoing price correction. The analyst notes that if the retracement persists into June, Bitcoin is likely to fall to around $97,000 -$99,000 at which it may find a credible market resistance. Daan Crypto’s selection of this price range as the next major support level for Bitcoin stems from a confluence of technical indicators. As seen in the chart below, the $97,000-$99,000 price region represents the mid range of Bitcoin trading channel between $90,845 and $108,386, alongside hosting the 200-day moving average and the 0.382 Fibonacci retracement level.
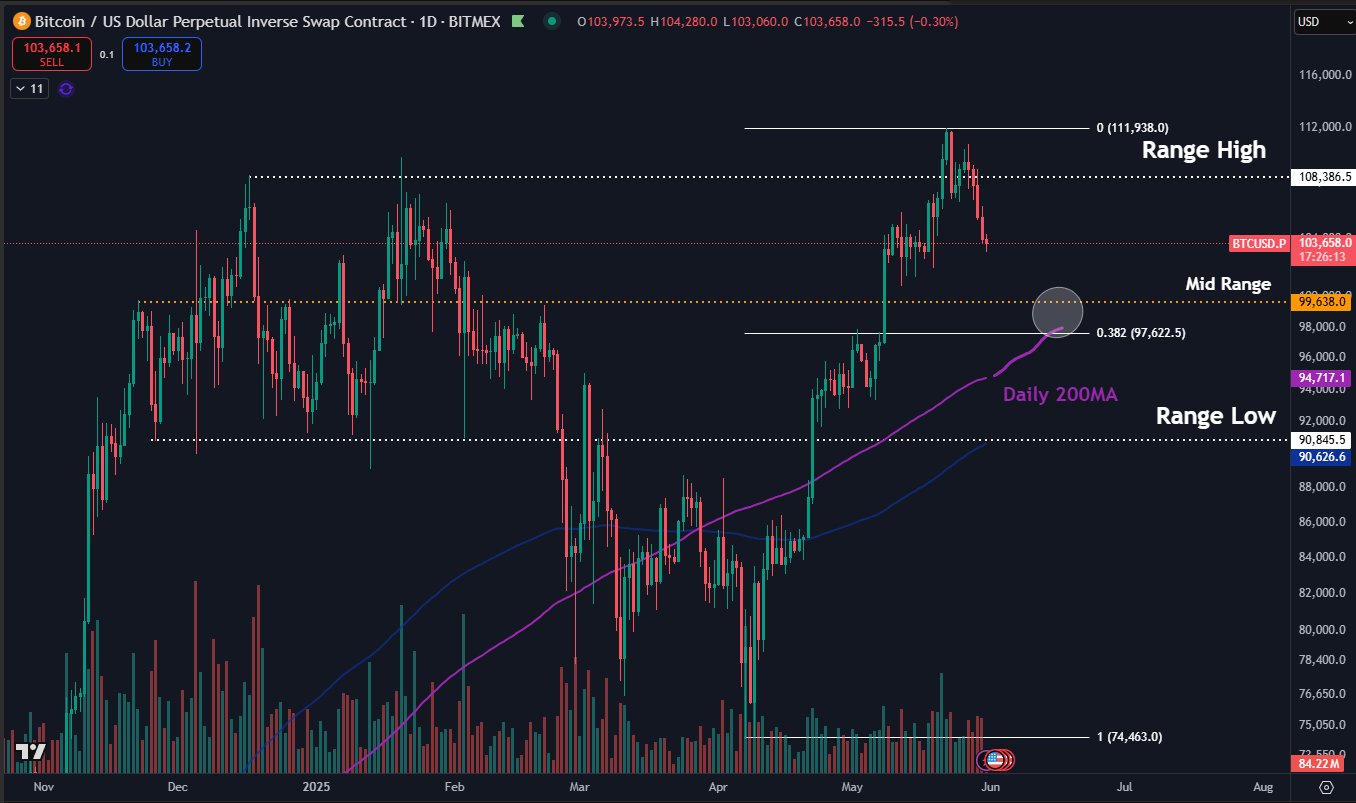
The mid-range in a trading channel usually serves as a key level of support or resistance, depending on where the price is relative to it. Amidst Bitcoin’s price correction, the current mid-range at $97,000-$99,000 represents the next major price floor for the premier cryptocurrency — a decisive price fall below which would signal a bearish price trend. Meanwhile, the 0.382 Fibonacci retracement level represents a healthy market correction zone meaning prices generally pull back to this area before resuming the initial trend. In addition, the 200 day MA is a long-term indicator averaging the market closing price over the past 200 days. It also functions as a support level during bullish trends acting as a common retest level before price continues an uptrend. Generally, all three indicators suggest the $97,000-$99,000 would act as a sound technical support zone should Bitcoin price dip any further. However, the loss of the support zone would threaten Bitcoin’s bullish potential with the next support level set around $94,000.
Bitcoin Price Overview
At press time, Bitcoin trades at $104,650 reflecting a slight price gain of 0.14% in the past day. The premier cryptocurrency also reports a monthly gain of 7.21% indicating that the majority of new market entrants remain in profits. However, the weekly decline of 2.86% suggests there is need for a resurgence in market demand to halt a creeping bearish sentiment investment.
Recommended Articles








Comments (0)
Click the $ button, enter the symbol, and select to link a stock, ETF, or other ticker.