


Bitcoin vs Gold Outlook: BTC and XAU pull back as US inflation rises in October



- Bitcoin slips below $74,000 on Tuesday as market participants react to US inflation data.
- Gold corrects near $4,050, weighed down by major moving averages and the dynamic SuperTrend indicator.
- US CPI rose 0.4% in October, above market expectations of 0.3%.
Bitcoin (BTC) and Gold (XAU/USD) sustain a broad bearish trend on Tuesday, with BTC hovering around $74,000 and XAU near $4,050. The path of least resistance remains downward for both assets, weighed down by weak technical structures and macroeconomic uncertainties.
Meanwhile, Gold appears supported at the pivotal $4,000 level, while Bitcoin continues to test lower demand areas toward $70,000.
US CPI rises in October
The United States (US) Consumer Price Index, released Tuesday by the Bureau of Labor Statistics (BLS), shows inflation rose 0.4% MoM in October. This print follows the 0.6% increase in September and came in above market expectations of 0.3%.
Excluding volatile food and energy prices, core CPI increased 0.3% in October, matching September’s print while surpassing market expectations of 0.2%.
This release did not include annual inflation figures because it lacks October 2025 monthly data due to the government shutdown from October 1, 2025, to November 12, 2025.
“We see little in today’s US inflation data to materially shift the market outlook, despite the slightly hotter-than-expected readings,” Joel Kruger, Global Markets Strategist at LMAX Group, said in a written commentary, adding, “With markets already pricing in a December Fed rate hike, there is limited scope for an additional hawkish repricing.”
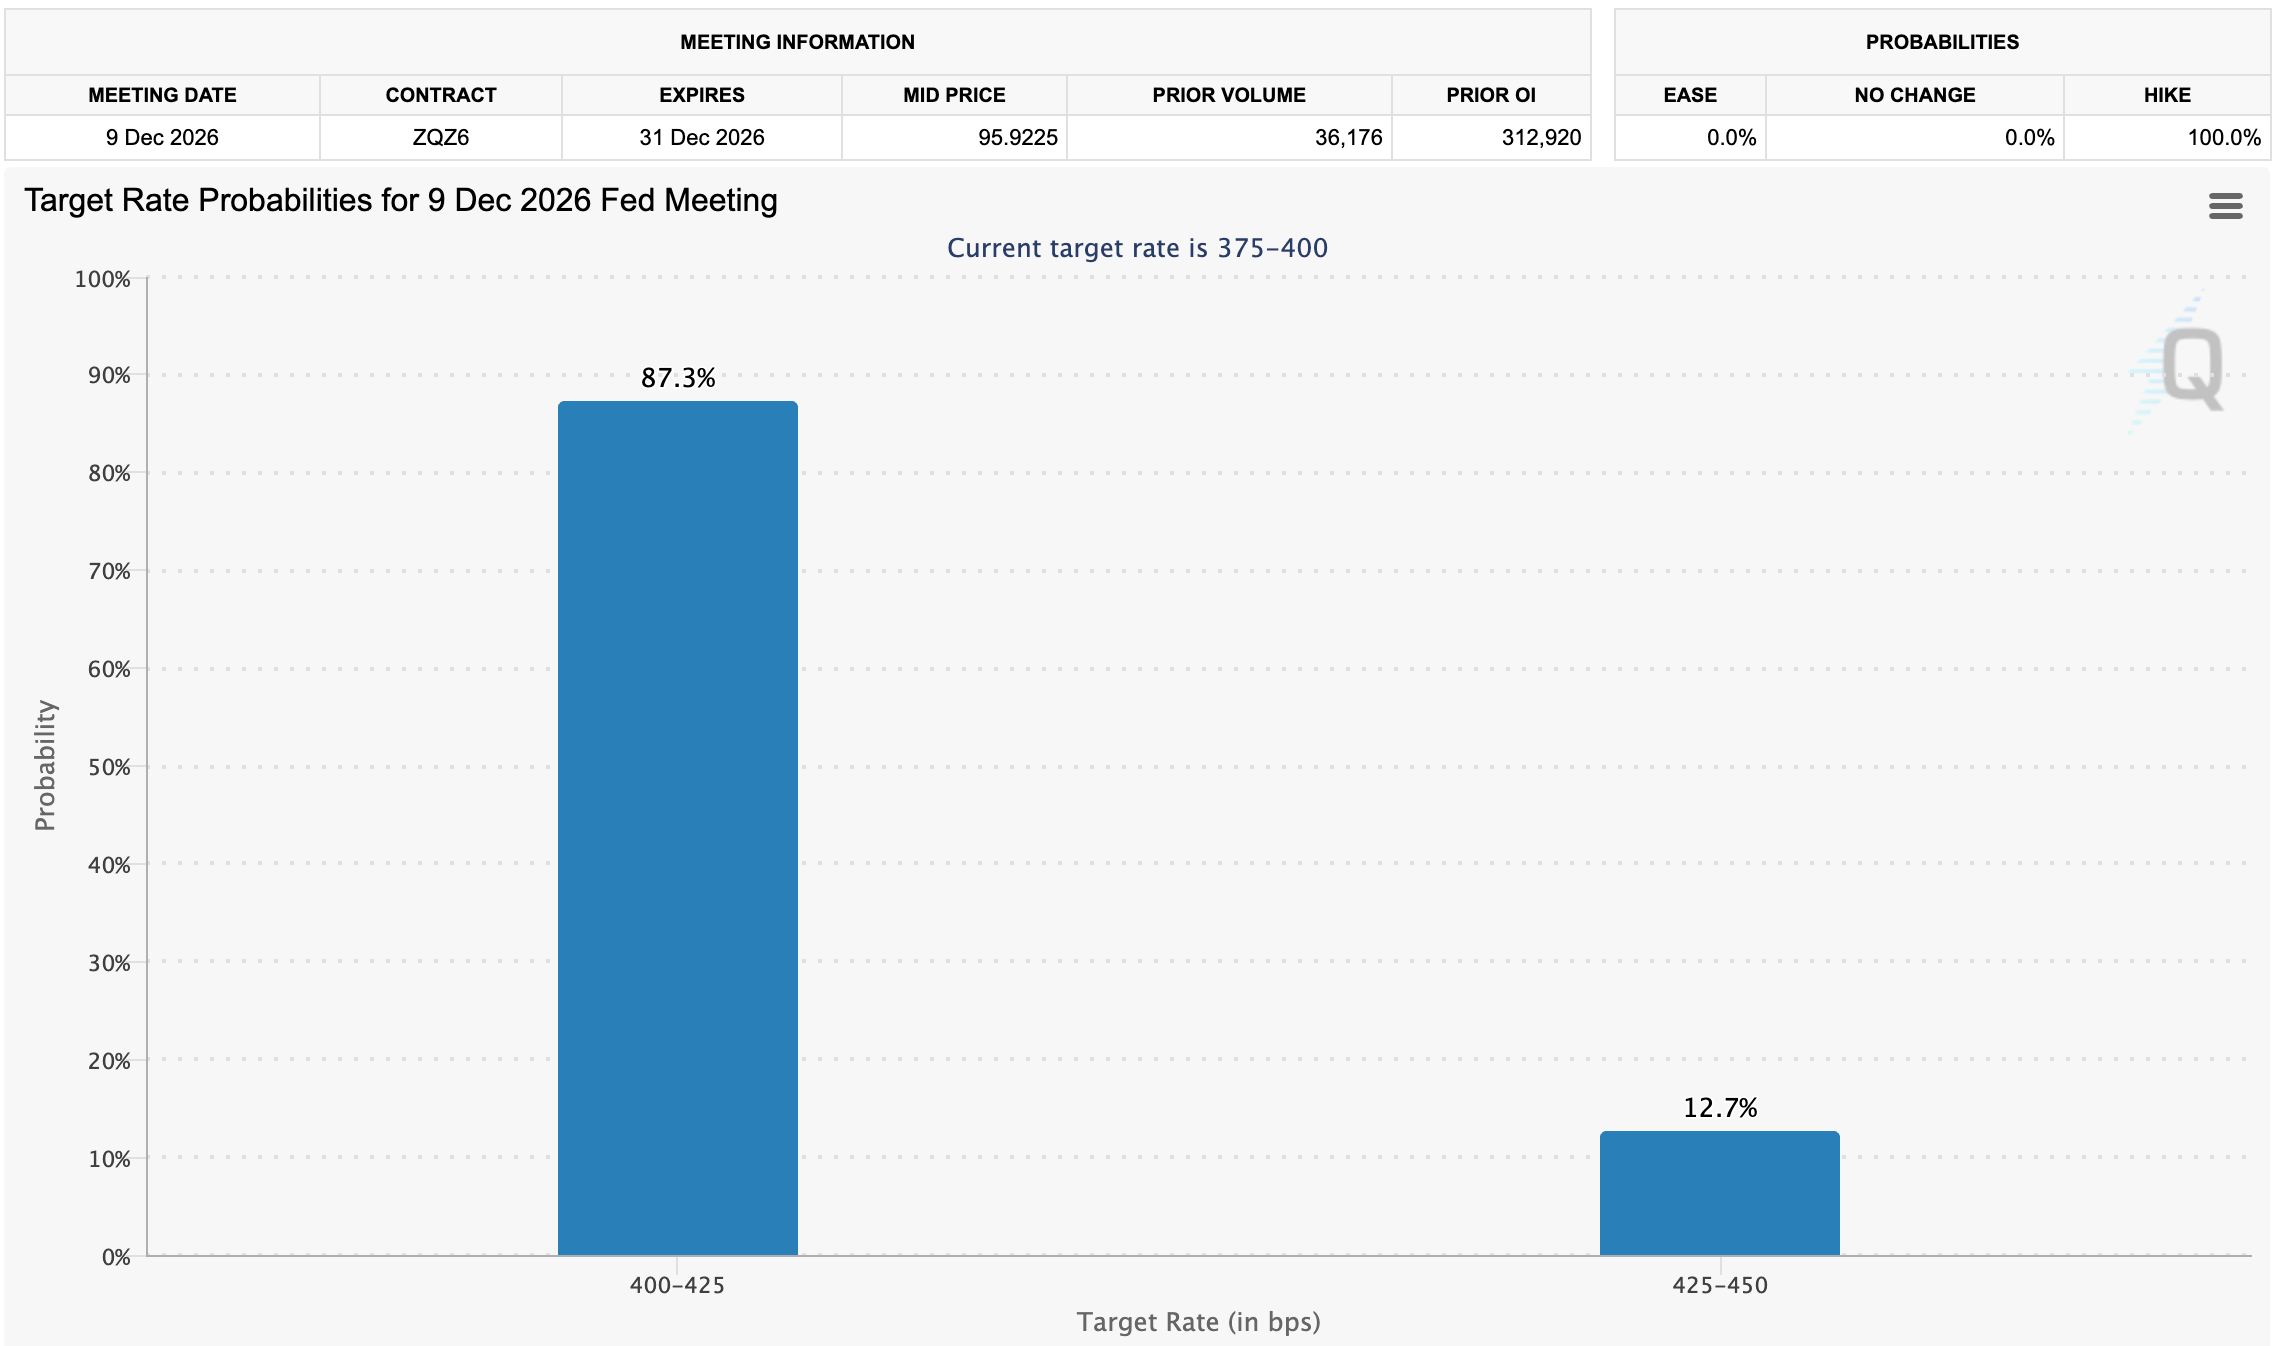
The CME Group’s FedWatch Tool shows that market participants are pricing in 87% odds that the Federal Reserve (Fed) will raise interest rates to the 4.00-4.25% range in December. This follows steady rates in October and a 25-basis-point hike in September, the first in three years.
Technical analysis: Bitcoin sellers retain control
Bitcoin trades at $74,051, maintaining a bearish near‑term bias as price holds below the key Exponential Moving Averages (EMAs). The 200‑day EMA at $76,460, the 100‑day EMA at $77,562 and the 50‑day EMA at $79,114 all sit overhead, suggesting that rebounds are likely to be capped while the pair remains under this stacked resistance layer.
Momentum metrics reinforce the cautious tone, with the Moving Average Convergence Divergence (MACD) line below its signal and under the zero line alongside a Relative Strength Index (RSI) near 35, hinting at ongoing downside pressure but not yet extreme oversold conditions.
On the topside, immediate resistance lies at the 200‑day EMA near $76,460, followed by the 100‑day EMA at roughly $77,562 and then the 50‑day EMA around $79,114, forming a dense overhead supply zone that bulls would need to reclaim to neutralize the current downtrend.
On the downside, structural demand appears only much higher, at the SuperTrend level around $81,208, which remains well above spot and will not come into play unless BTC stages a broader recovery. Until then, the pair is vulnerable to further downside while trapped beneath the daily EMA cluster.
Gold technical analysis: XAU erases gains amid growing selling pressure
Gold trades at $4,055, maintaining a bearish near-term bias as it holds below a dense band of moving averages and trend resistance. The yellow metal remains below the 50-day EMA at roughly $4,150, while the 100-day and 200-day EMAs near $4,229 and $4,257, respectively, reinforce the broader topside cap, in line with a still-active downward resistance trendline whose break level sits much higher around $4,337.
A SuperTrend signal near $4,163 also stays above spot, underscoring that any recovery is still a corrective bounce within a capped structure, even as the MACD has turned positive and the RSI hovers just below the 50 line, hinting at only modest momentum stabilization rather than a clear bullish reversal.
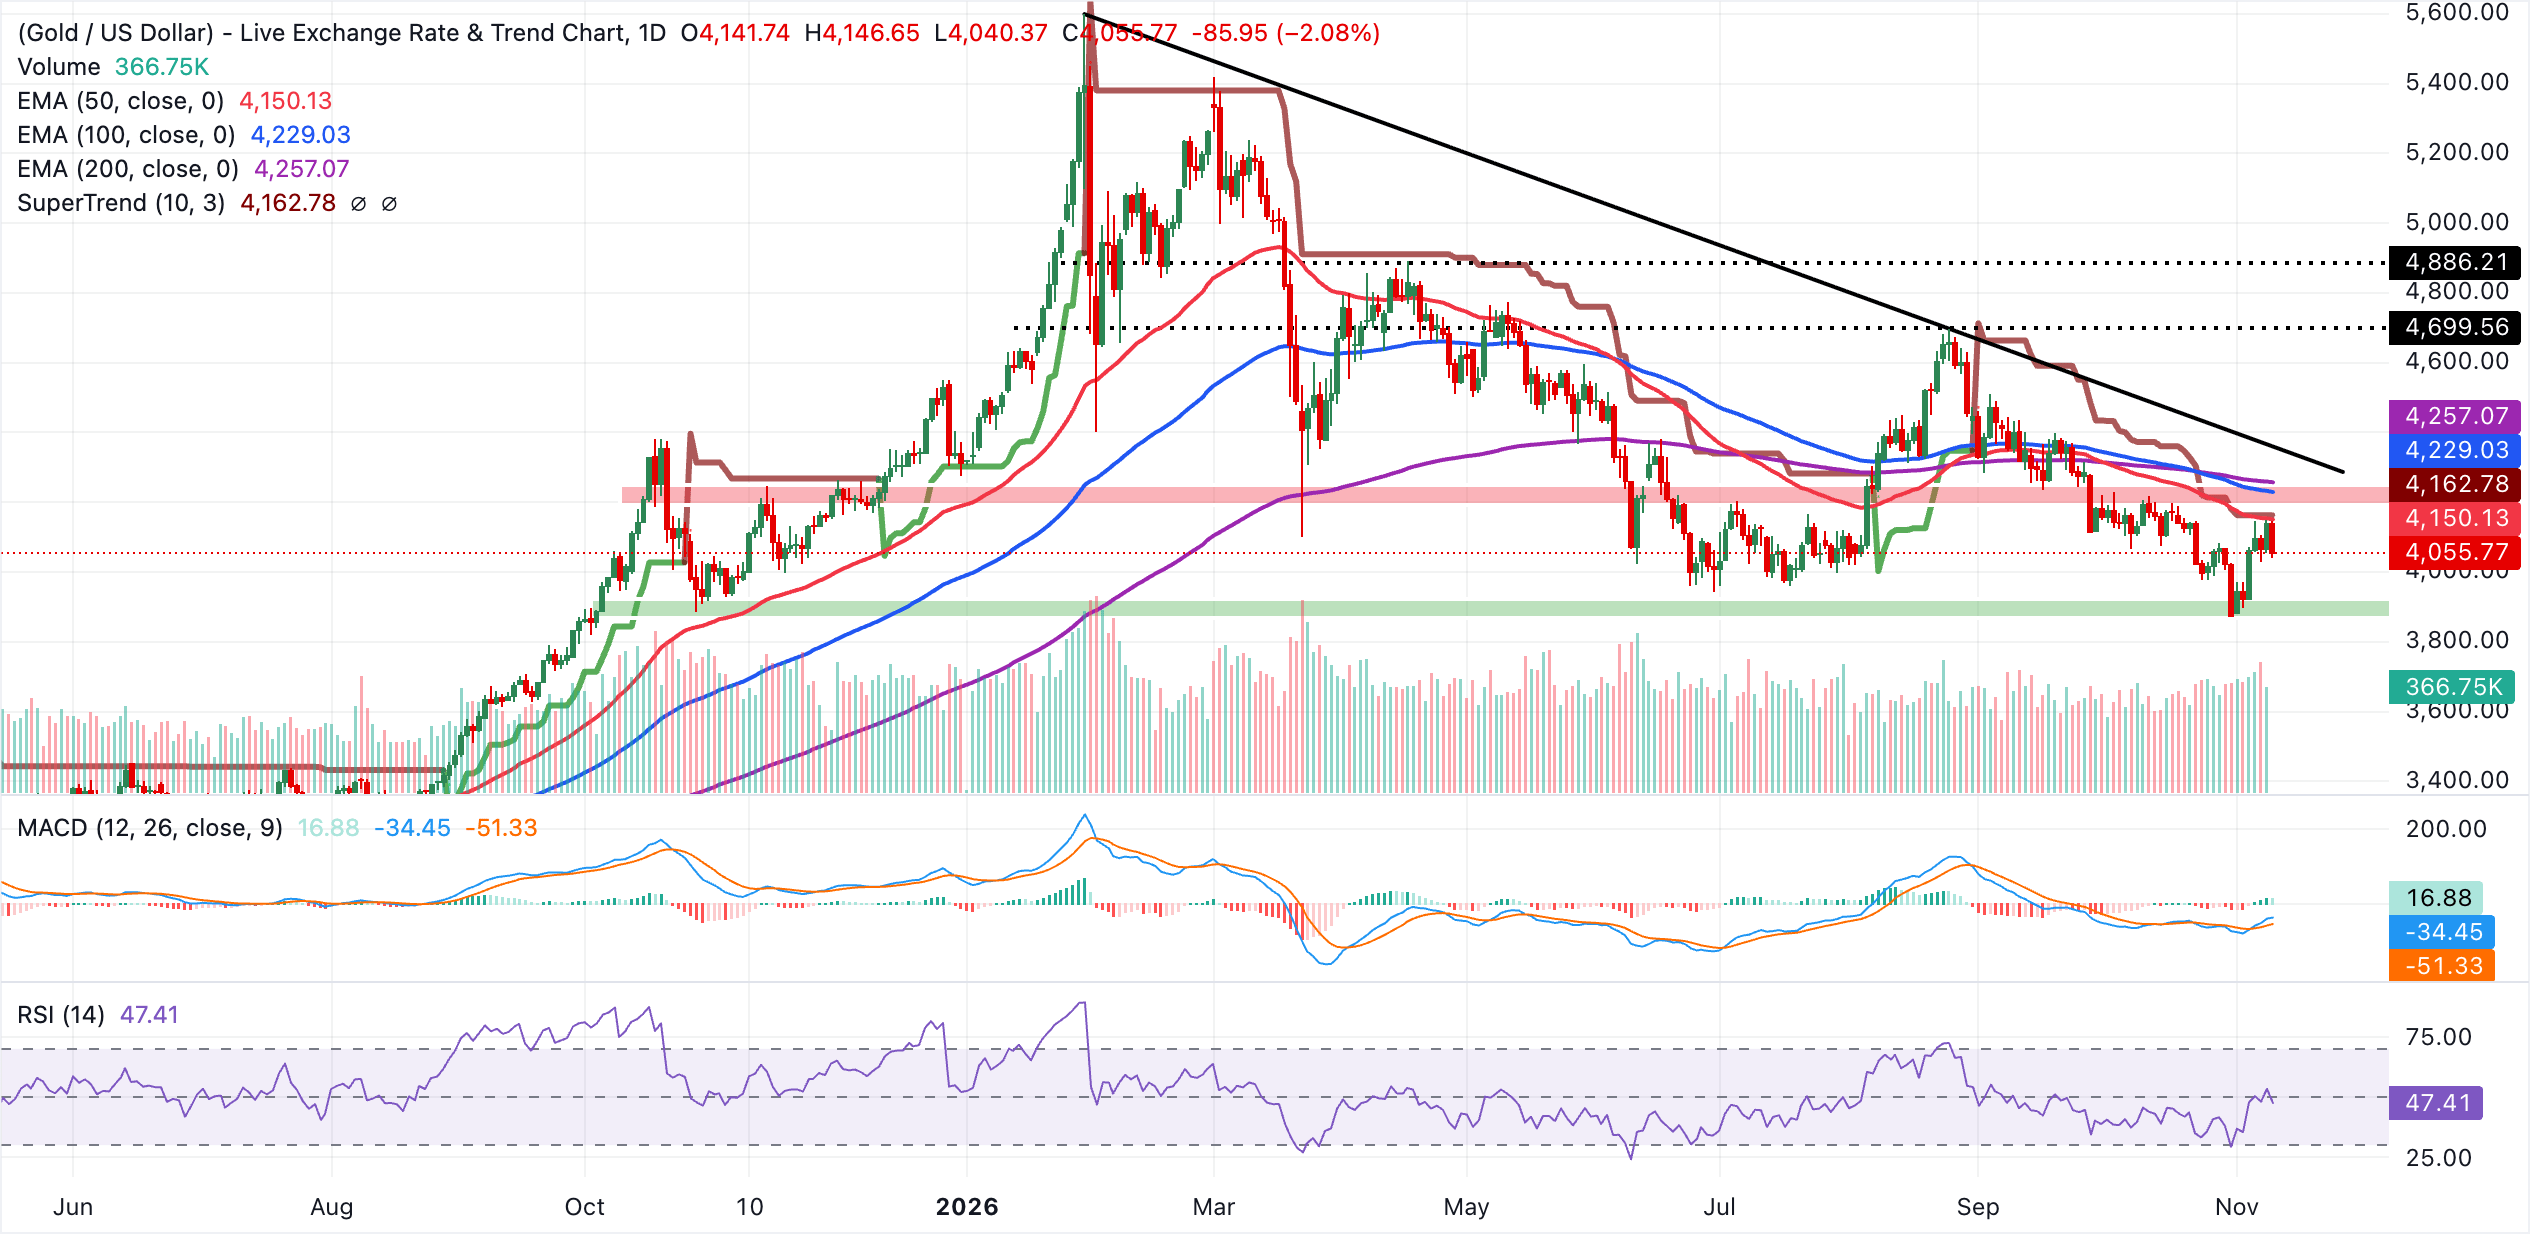
Initial resistance emerges at the 50-day EMA around $4,150, with the SuperTrend barrier close by near $4,163 forming a first supply cluster that bulls would need to clear to ease immediate downside pressure. Above that, the 100-day EMA at about $4,229 and the 200-day EMA near $4,257 create a wider resistance band, while the downward resistance trendline’s break price around $4,337 marks a more decisive medium-term hurdle whose recovery would be required to negate the prevailing bearish bias. Without identifiable nearby support from the provided levels on the daily chart, any fresh weakness below $4,055 would leave Gold vulnerable to further downside exploration until a new demand zone develops on the chart.
(The technical analysis of this story was written with the help of an AI tool. Know more.)
Bitcoin, altcoins, stablecoins FAQs
Bitcoin is the largest cryptocurrency by market capitalization, a virtual currency designed to serve as money. This form of payment cannot be controlled by any one person, group, or entity, which eliminates the need for third-party participation during financial transactions.
Altcoins are any cryptocurrency apart from Bitcoin, but some also regard Ethereum as a non-altcoin because it is from these two cryptocurrencies that forking happens. If this is true, then Litecoin is the first altcoin, forked from the Bitcoin protocol and, therefore, an “improved” version of it.
Stablecoins are cryptocurrencies designed to have a stable price, with their value backed by a reserve of the asset it represents. To achieve this, the value of any one stablecoin is pegged to a commodity or financial instrument, such as the US Dollar (USD), with its supply regulated by an algorithm or demand. The main goal of stablecoins is to provide an on/off-ramp for investors willing to trade and invest in cryptocurrencies. Stablecoins also allow investors to store value since cryptocurrencies, in general, are subject to volatility.
Bitcoin dominance is the ratio of Bitcoin's market capitalization to the total market capitalization of all cryptocurrencies combined. It provides a clear picture of Bitcoin’s interest among investors. A high BTC dominance typically happens before and during a bull run, in which investors resort to investing in relatively stable and high market capitalization cryptocurrency like Bitcoin. A drop in BTC dominance usually means that investors are moving their capital and/or profits to altcoins in a quest for higher returns, which usually triggers an explosion of altcoin rallies.
Recommended Articles








Comments (0)
Click the $ button, enter the symbol, and select to link a stock, ETF, or other ticker.