


Silver Price Forecast: XAG/USD looks indecisive, flat lines above $31.00 mark



- Silver oscillates in a range on the last trading day of the week.
- A mixed technical setup warrants caution for aggressive traders.
- Acceptance above $32.00 will set the stage for additional gains.
Silver (XAG/USD) struggles to capitalize on its modest intraday uptick and trades around the $31.15 region during the first half of the European session on Friday, nearly unchanged for the day.
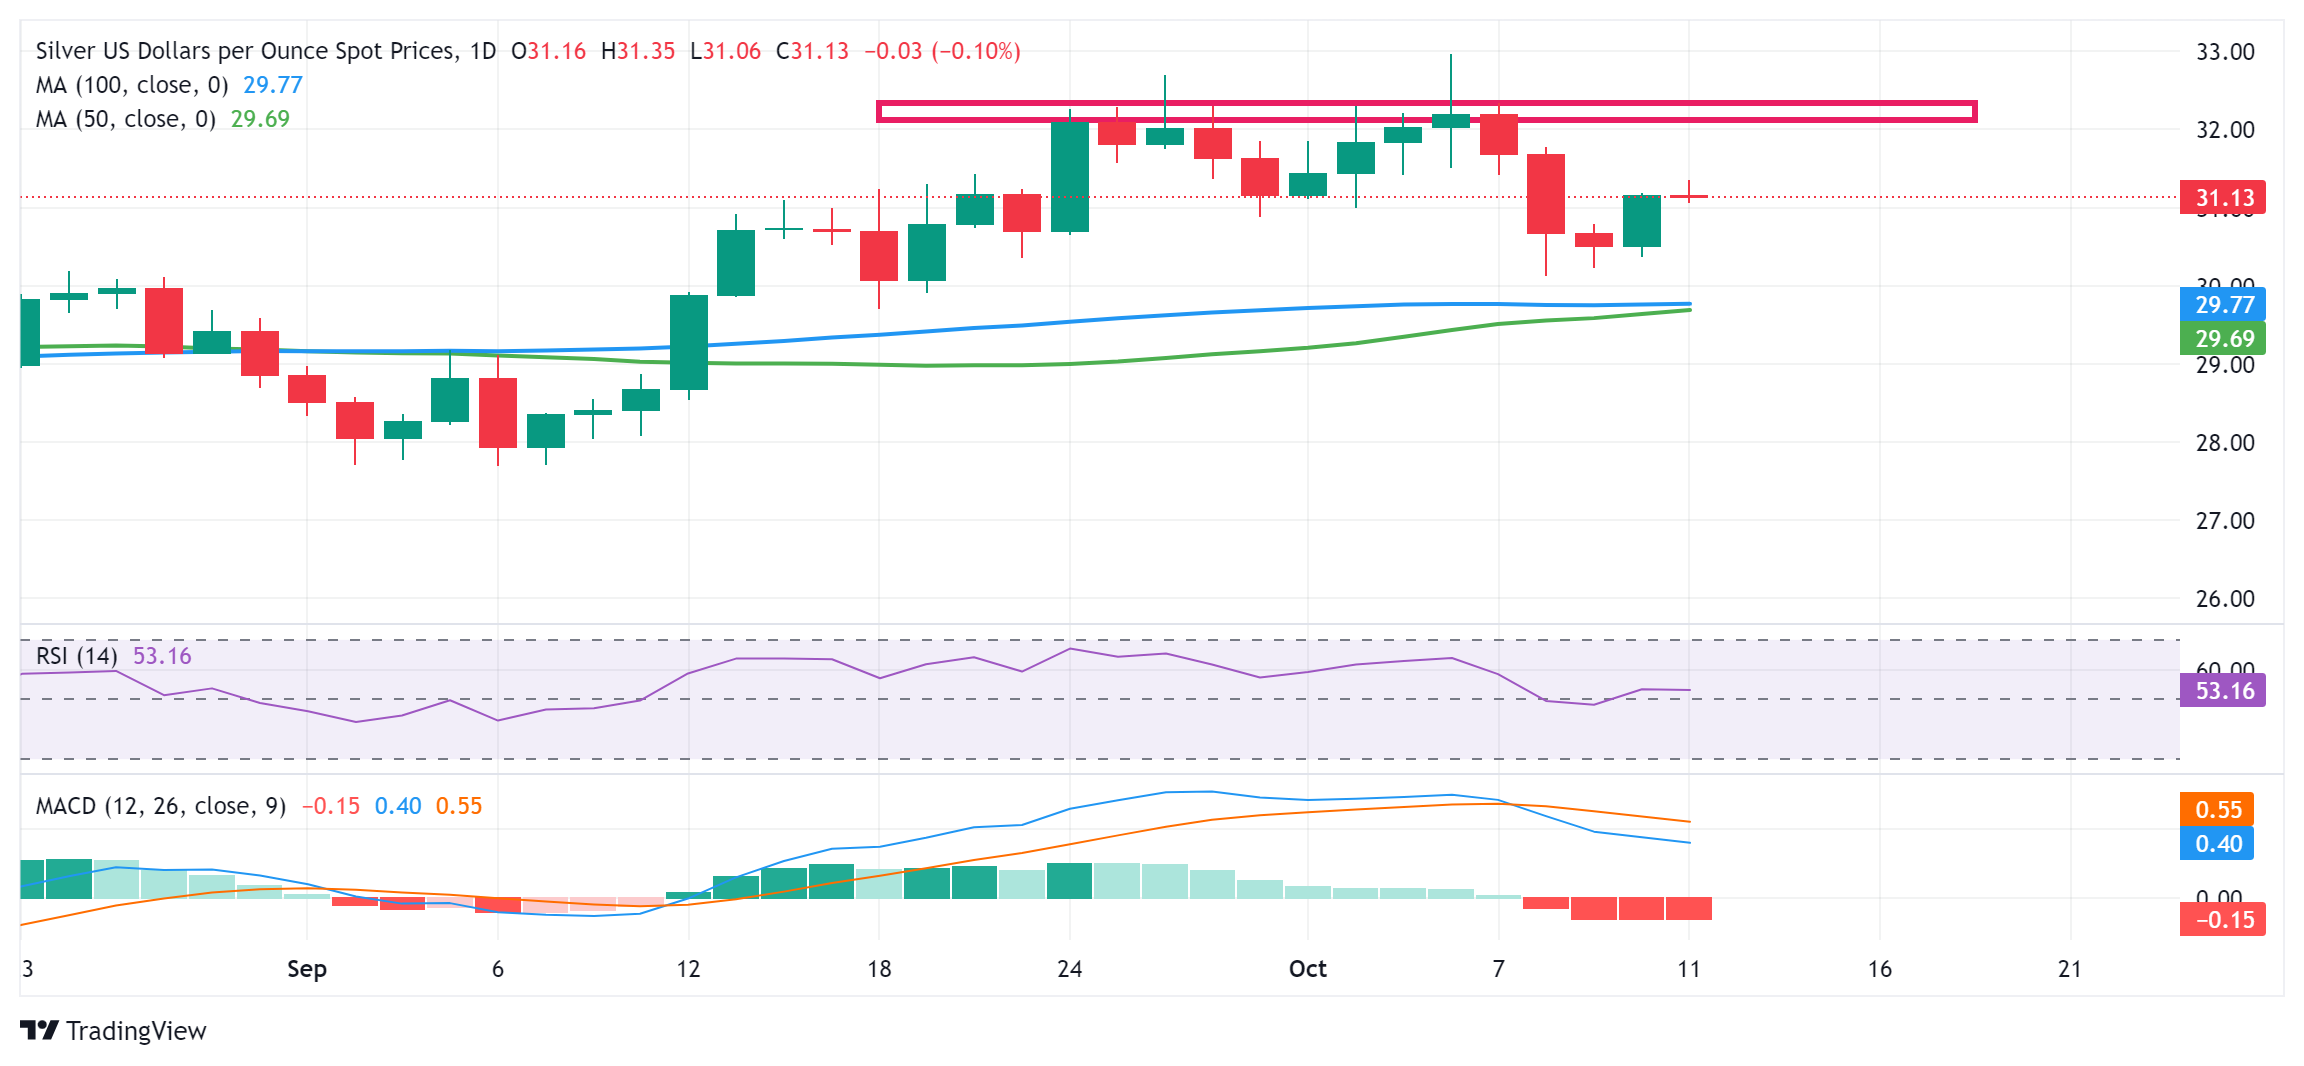
Looking at the broader picture, this week's bounce from the vicinity of the $30.00 psychological mark and a subsequent strength back above the $31.00 mark favors bullish traders. That said, the recent repeated failures to capitalize on momentum beyond the $32.00 mark constitute the formation of a bearish multiple-tops pattern. This, along with mixed oscillators on the daily chart, warrants caution before positioning for any meaningful appreciating move for the XAG/USD.
From current levels, the $31.55 region is likely to act as an immediate hurdle ahead of the $31.75-$31.80 area and the $32.00 mark. This is followed by resistance near the 32.25 supply zone, which if cleared decisively has the potential to lift the XAG/USD back towards the multi-year peak, just ahead of the $33.00 round figure touched last Friday. Some follow-through buying should pave the way for a move towards the December 2012 swing high, around the $33.85 region.
On the flip side, weakness below the $31.00 round figure now seems to find some support near the $30.70-$30.65 region ahead of the $30.35-$30.25 area and the $30.00 mark. The next relevant support is pegged near the $29.80-$29.70 confluence – comprising the 100-day Simple Moving Average (SMA) and the 50-day SMA. This should act as a key pivotal point, which if broken will set the stage for an extension of the recent decline from the highest level since December 2012.
The XAG/USD might then accelerate the downfall towards the $29.00 mark before eventually dropping to test the $28.60-$28.50 zone. The descending trend could extend further towards the $28.10-$28.00 region en route to the September monthly swing low, around the $27.70 area.
Silver daily chart
Recommended Articles









Comments (0)
Click the $ button, enter the symbol, and select to link a stock, ETF, or other ticker.