tradingkey.logo
tradingkey.logo
Search

UK100

UK100
Add to Watchlist

10878.800

-16.600-0.15%

UK100 Technical Analysis

Explore UK100 technical analysis across multiple timeframes, including summary signals, technical indicators, and moving averages. Use buy, sell, neutral, strong buy, and strong sell readings to assess UK100 trend direction, market momentum, volatility, and potential support or resistance areas.

1m
5m
15m
30m
1h
2h
4h
D
W
M
1m
5m
15m
D
Buy

Summary

Buy
Strong buy

Technical Indicators

Track UK100 technical indicators such as RSI, MACD, KDJ, StochRSI, ATR, CCI, Williams %R, and TRIX. These indicators help evaluate momentum, volatility, overbought or oversold conditions, and possible trend changes in the UK100.

Sell(1)
Neutral(3)
Buy(2)
IndicatorsValueDirection
MACD(12,26,9)-5.447
Neutral
RSI(14)60.043
Neutral
STOCH(KDJ)(9,3,3)81.880
Buy
ATR(14)82.971
Low Volatility
CCI(14)98.179
Neutral
Williams %R27.436
Buy
TRIX(12,20)0.044
Sell
StochRSI(14)88.634
Overbought

Moving Average

View UK100 moving average signals from MA5 to MA200 and compare different trend levels to see whether UK100 is trading above or below key moving averages and whether the current trend leans bullish, bearish, or neutral.

Sell(0)
Neutral(0)
Buy(6)
IndicatorsValueDirection
MA510832.040
Buy
MA1010788.490
Buy
MA2010828.940
Buy
MA5010667.130
Buy
MA10010535.893
Buy
MA20010444.531
Buy

UK100 Trading Strategy

Intraday
Medium Term
Short Term
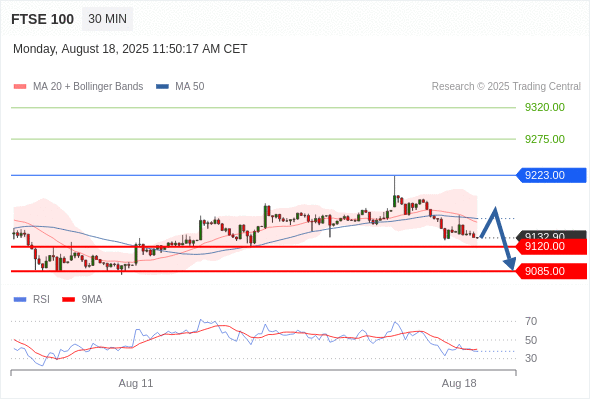
Short positions below 9223.00 with targets at 9120.00 & 9085.00 in extension.

Trading Strategy

Short positions below 9223.00 with targets at 9120.00 & 9085.00 in extension.

Alternative scenario

above 9223.00 look for further upside with 9275.00 & 9320.00 as targets.

Comment

short positions below 9223.00 with targets at 9120.00 & 9085.00 in extension.

Aug 18, 2025
Source: Trading Central(Reference Only)

FAQ

What does RSI mean for UK100?

RSI measures recent price momentum. A high RSI may indicate strong momentum or overbought conditions, while a low RSI may indicate weak momentum or oversold conditions.

What does MACD mean for UK100?

MACD helps identify momentum shifts and potential trend changes by comparing short-term and longer-term moving averages.

How do UK100 moving averages work?

Moving averages smooth UK100 price data over selected periods. MA5 and MA10 reflect short-term trends, MA20 and MA50 reflect medium-term trends, and MA100 and MA200 are often used for longer-term trend reference.

UK100

10878.800
-16.600-0.15%
tradingkey.logo
Risk Warning: Our Website and Mobile App provides only general information on certain investment products. Finsights does not provide, and the provision of such information must not be construed as Finsights providing, financial advice or recommendation for any investment product.
Investment products are subject to significant investment risks, including the possible loss of the principal amount invested and may not be suitable for everyone. Past performance of investment products is not indicative of their future performance.
Finsights may allow third party advertisers or affiliates to place or deliver advertisements on our Website or Mobile App or any part thereof and may be compensated by them based on your interaction with the advertisements.
© Copyright: FINSIGHTS MEDIA PTE. LTD. All Rights Reserved.