


Bitcoin Price Prediction: BTC Soars Past $87,000, Will It Continue to Rise This Year?



AI Podcast


On September 22, Bitcoin surged over 5% to briefly touch an eight-month high of $87,000 before pulling back to $85,265. The rally was driven by improved liquidity, declining crude oil prices, rising U.S. equities, and record spot ETF net inflows of about $1 billion. Breaking the $82,000 resistance triggered strong technical buying. Analysts identify the next key resistance at $90,000–$92,000, while $82,000 now serves as critical support. Easing global inflation and favorable risk sentiment could potentially propel Bitcoin toward $100,000 later this year, though short-term pullbacks remain possible.

TradingKey - Bitcoin Surges to Briefly Break $87,000; Where Is the Next Key Resistance Level?
On September 22, Bitcoin (BTC) strongly broke through the past month's resistance level of $82,000, surging over 5% intraday to briefly reach $87,000, setting an 8-month high. As of press time, Bitcoin price has pulled back, temporarily trading at $85,265.
Following a rate hike by the U.S. Federal Reserve (Fed) on September 16 and the failure of the U.S. Congress to pass the cryptocurrency bill "CLARITY Act," the market experienced a brief decline. However, as the market quickly digested this negative news, improving macroeconomic conditions and a rebound in risk appetite provided new support for Bitcoin prices.
Specifically, lower U.S. Treasury yields improved market liquidity conditions, while international crude oil prices fell noticeably by over 3%, lowering global inflation expectations and creating room for a rebound in risk assets. Yesterday, the three major U.S. stock indices rose across the board, with the Nasdaq Composite Index surging over 2%. As overall market risk appetite warmed up, capital simultaneously flooded into high-elasticity assets like Bitcoin, with U.S. spot Bitcoin ETFs recording a net inflow of approximately $1 billion yesterday, setting a single-day high since October 2025.
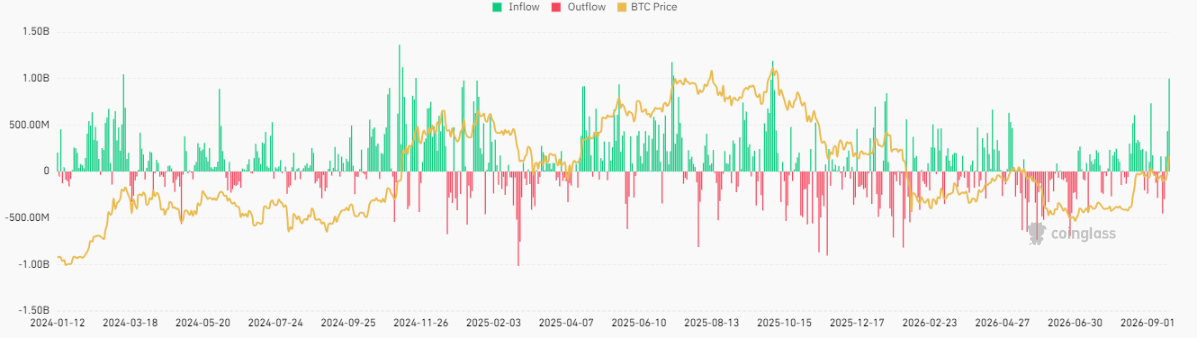 Spot Bitcoin ETF fund flows, Source: Coinglass
Of course, after breaking out of the long-standing consolidation range and psychological barrier of $80,000–$82,000, Bitcoin presented strong bullish signals on technical charts. This not only triggered buying orders from numerous quantitative trading programs but also attracted FOMO buying from retail investors, further expanding gains.
After Bitcoin briefly touched $87,000, Nansen analyst Nicolai Sondergaard believes the next key level is $90,000–$92,000, which coincides with the 0.5 Fibonacci resistance level. However, after surging higher, Bitcoin price quickly triggered selling pressure, leading to a significant pullback. From a technical analysis perspective, there is a need for Bitcoin price to retest $82,000, a former resistance level that has turned into support; thus, as long as it does not fall below this level, it remains a healthy correction.
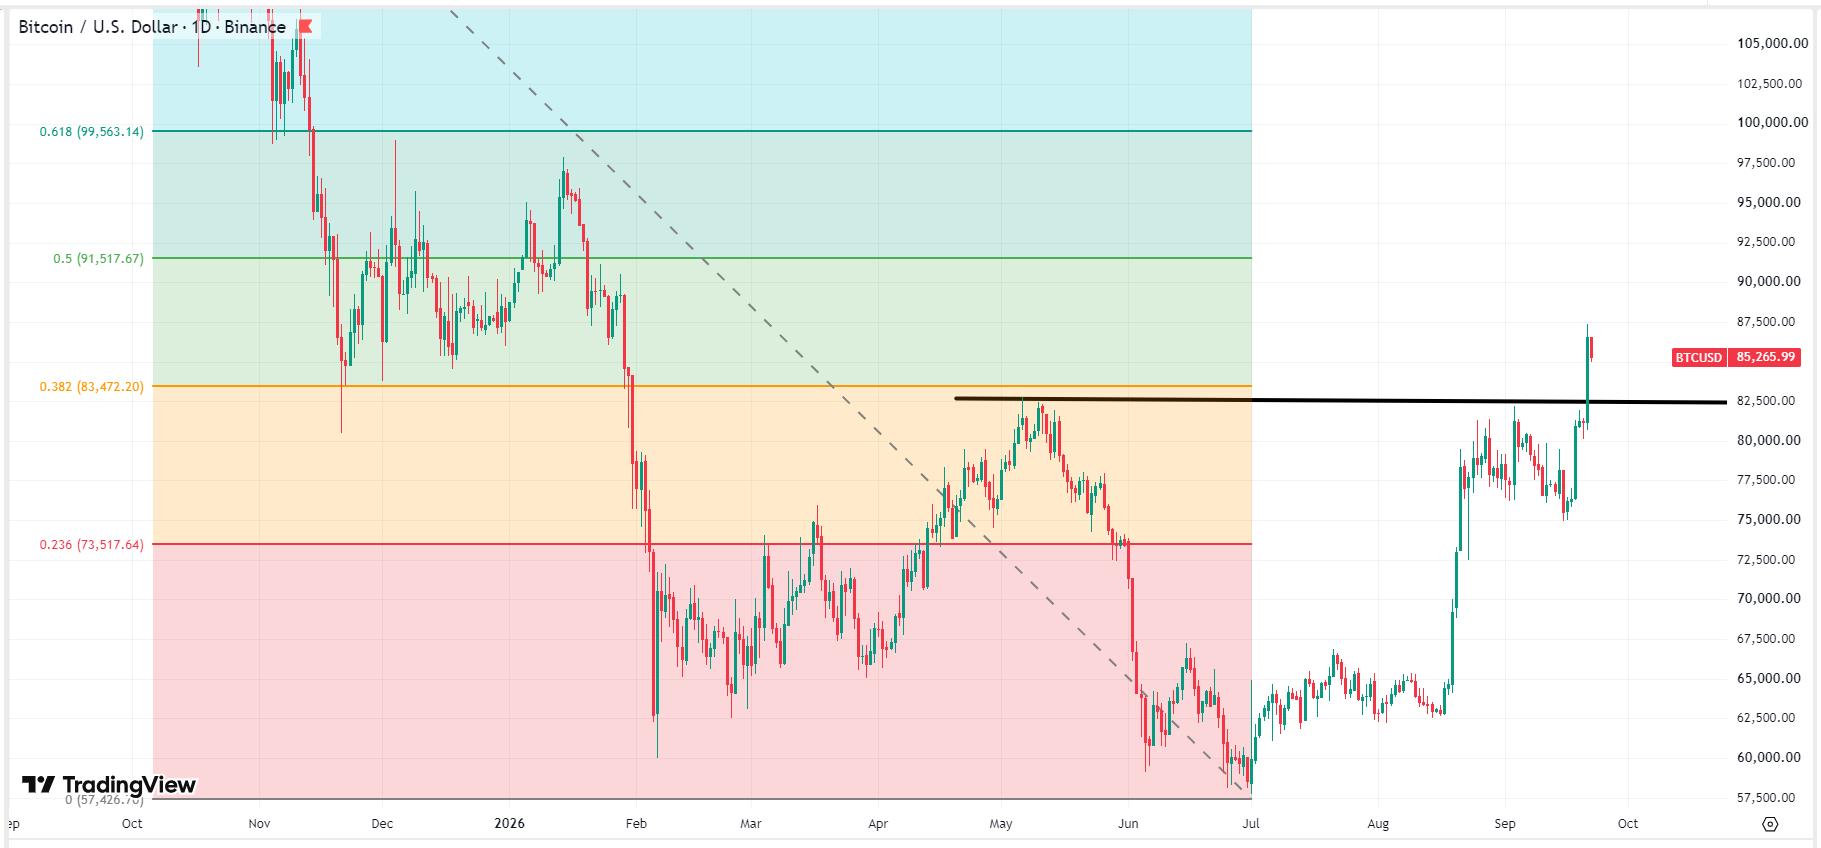 Bitcoin price chart, Source: TradingView
Currently, U.S. crypto regulation leans favorable, though macroeconomic uncertainty may tilt toward tightening; nevertheless, falling international crude oil prices have lowered global inflation expectations. If inflationary pressures ease further, macroeconomic policies will shift toward supporting risk assets, and it is not ruled out that Bitcoin prices could continue to rally toward $100,000 this year.
This content was translated using AI and reviewed for clarity. It is for informational purposes only.
Recommended Articles












Comments (0)
Click the $ button, enter the symbol, and select to link a stock, ETF, or other ticker.