tradingkey.logotradingkey.logo
Discount
TradingKey Pro

AI-Powered Stock Picker
Quant-driven & Fundamentally validated

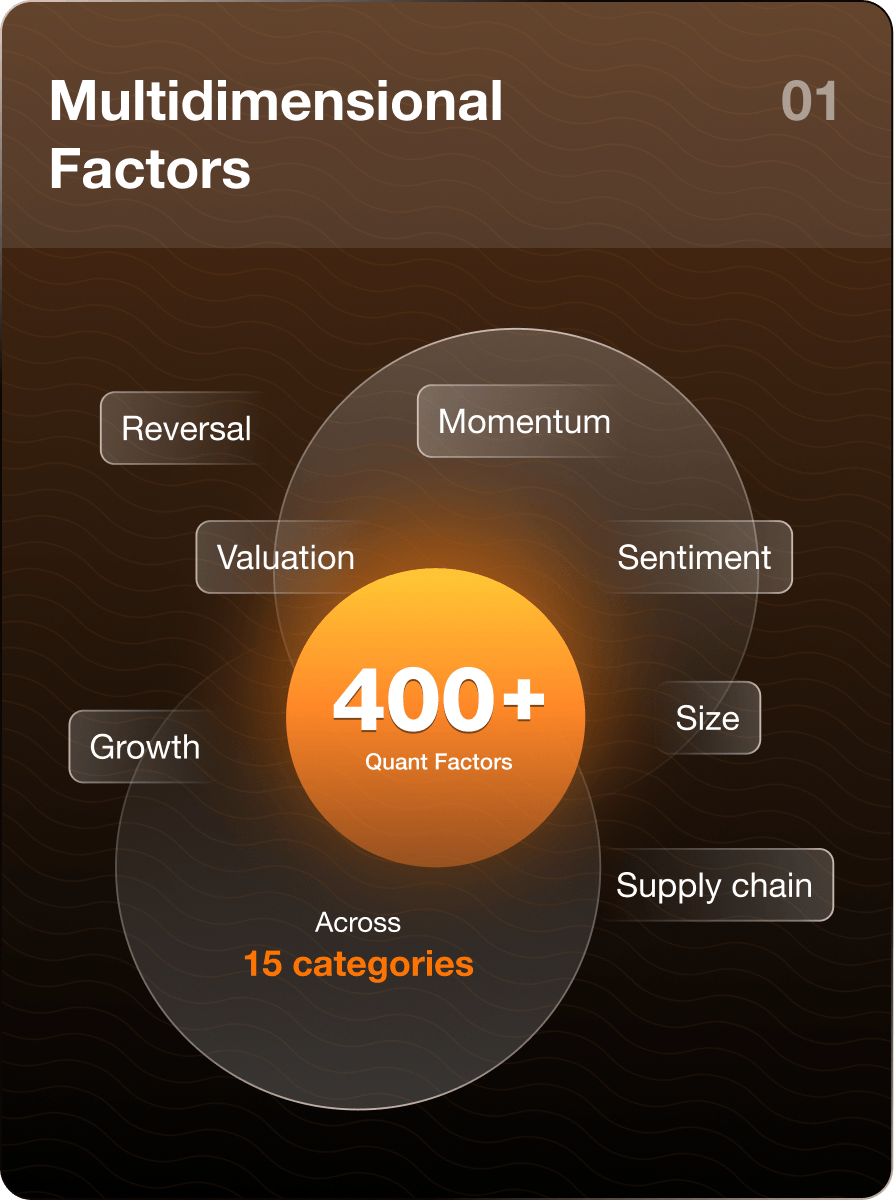
Powered by 400+ quantitative factors, 15 analytical categories, and AI-driven portfolio modeling, TradingKey Pro goes beyond the numbers to uncover promising stocks—including opportunities Wall Street may have overlooked.

--/year (regularly --/year), with a 7-day money-back guarantee

SmartPicks

+478.36%

S&P 500 ETF

+123.52%

Performance period: Jan 31, 2020 to Nov 17, 2026. Past performance is not indicative of future results.

How Do We Outperform the Market?

TradingKey Pro VS S&P 500

AI Prime Alpha

AI combines financial, market, and alternative data to uncover stock-picking insights

Historical Performance of Selected Stocks

AI Prime Alpha

Alphabet Inc

Date selected
2025-07-31
Date sold
2025-10-31
Total return46.53%
AI Prime Alpha

Securitize

Date selected
2026-07-31
Date sold
2026-09-30
Total return118.74%
High-Tech Elites

Fortinet Inc

Date selected
2026-04-30
Date sold
2026-07-31
Total return92.09%
Small & Mid-Cap Risers

AXT Inc

Date selected
2026-01-30
Date sold
2026-02-27
Total return104.42%
Technical Master

Dave Inc

Date selected
2025-03-31
Date sold
2025-06-30
Total return224.72%
High-Tech Elites

FormFactor Inc

Date selected
2026-08-31
Date sold
2026-09-30
Total return48.40%
AI Prime Alpha

Alphabet Inc

Date selected
2025-07-31
Date sold
2025-10-31
Total return46.53%
AI Prime Alpha

Securitize

Date selected
2026-07-31
Date sold
2026-09-30
Total return118.74%
High-Tech Elites

Fortinet Inc

Date selected
2026-04-30
Date sold
2026-07-31
Total return92.09%
Small & Mid-Cap Risers

AXT Inc

Date selected
2026-01-30
Date sold
2026-02-27
Total return104.42%
Technical Master

Dave Inc

Date selected
2025-03-31
Date sold
2025-06-30
Total return224.72%
High-Tech Elites

FormFactor Inc

Date selected
2026-08-31
Date sold
2026-09-30
Total return48.40%

What do you get with Tradingkey Pro

Find Your Investment Direction

5 Investment Strategies

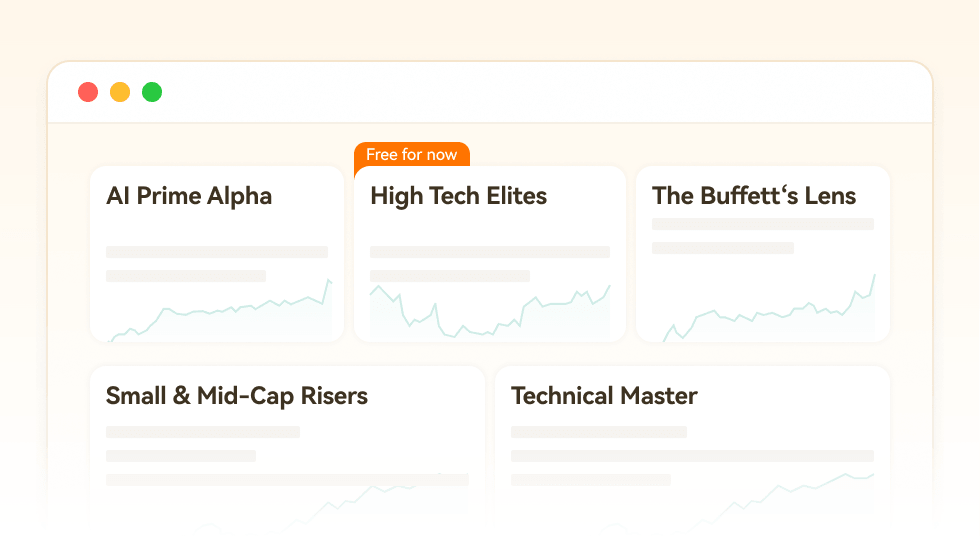
Discover U.S. stocks through: AI multi-factor analysis, technology growth, long-term value, small- and mid-cap growth, and price and volume trends.

Narrowing the scope of attention

10–20 Stocks per Strategy

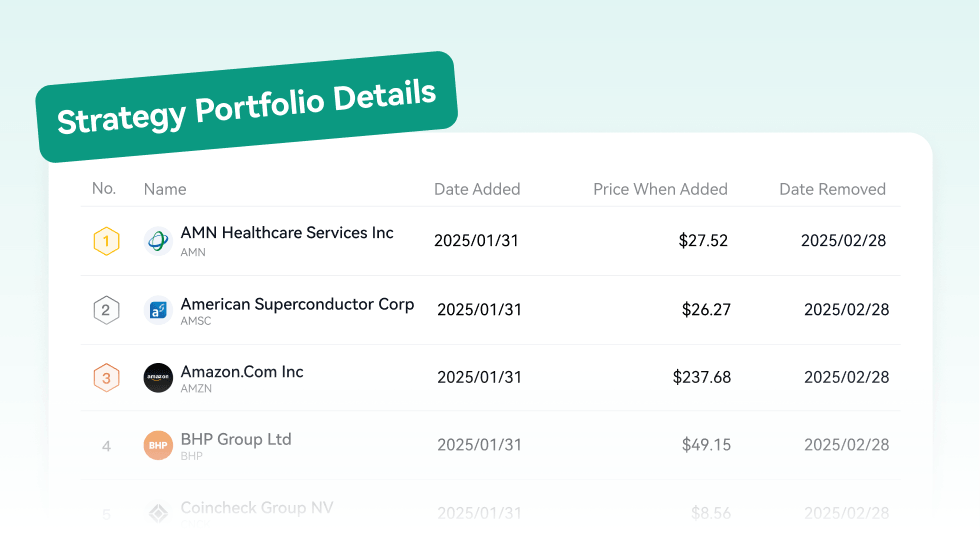
Our stock lists are updated monthly, with each strategy highlighting 10–20 companies for further research.

Understanding investment opportunities

Monthly In-Depth 1 Stock Analysis

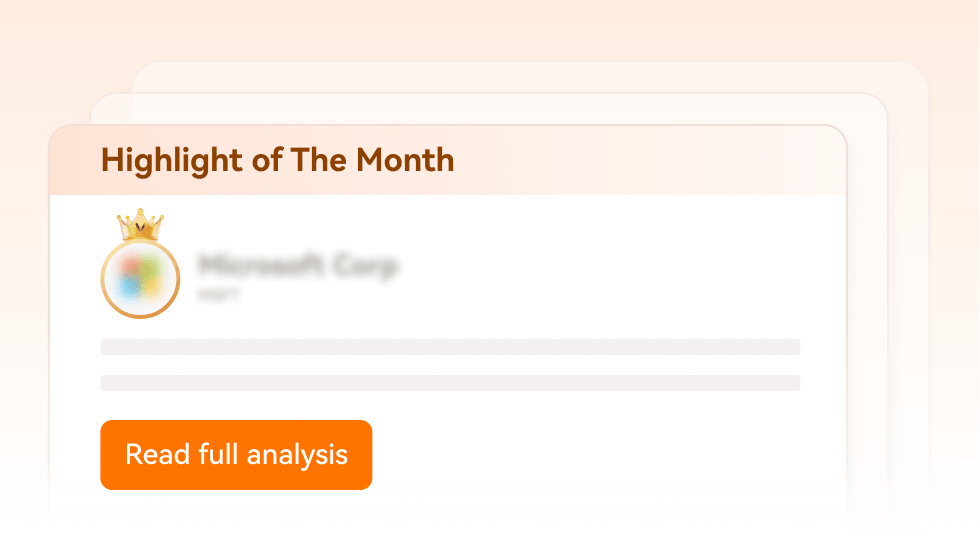
Get a detailed monthly report on a selected company, covering its business, financials, valuation, growth drivers, and key risks.

Find Your Investment Direction

5 Investment Strategies

Discover U.S. stocks through: AI multi-factor analysis, technology growth, long-term value, small- and mid-cap growth, and price and volume trends.

Narrowing the scope of attention

10–20 Stocks per Strategy

Our stock lists are updated monthly, with each strategy highlighting 10–20 companies for further research.

Understanding investment opportunities

Monthly In-Depth 1 Stock Analysis

Get a detailed monthly report on a selected company, covering its business, financials, valuation, growth drivers, and key risks.

How Do Our Investment Strategies Work?

Multidimensional FactorsSmart Scoring SystemFeatured Strategies

Choose your plan

  • Professional research tools
  • In-depth market insights
  • Same benefits with either plan
Loading...

FAQs

Who is TradingKey Pro for?

TradingKey Pro is designed for all types of investors, especially those who want to spend less time screening stocks, discover U.S. stock ideas for further research, and understand the reasoning behind each pick.

How does TradingKey Pro identify strong performers and stocks with upside potential?

Each stock pick is supported by multiple factors. We assess its relative appeal within the strategy while considering portfolio risk, sector exposure, and other allocation constraints. Our quantitative specialists analyze large datasets and use advanced strategy optimization and risk management tools to identify high-conviction investment opportunities. TradingKey Pro’s 5 strategies screen stocks across dimensions such as growth, valuation, financial quality, and price and volume trends. Each strategy combines quantitative screening of thousands of stocks with company fundamentals and industry research to select 10–20 of the strongest candidates with substantial upside potential, forming a model portfolio.

How are strategy and benchmark returns calculated?

Strategy returns are based on each holding’s price change over its holding period and its portfolio weight. Returns are compounded across periods to calculate cumulative returns. Benchmark returns reflect the performance of the reference index or ETF shown on the page over the same period. Details on the treatment of dividends, fees, transaction costs, and the reporting currency are disclosed on the page. Actual trading results may differ from the results shown.

How often are the 5 strategies rebalanced?

Each strategy is reviewed and rebalanced monthly using the latest available data and its own selection rules. This includes reassessing candidate stocks and portfolio allocations. Not every holding changes at each rebalance; stocks that continue to meet the criteria may be retained. See the strategy page for the specific rebalancing schedule.

Is the historical performance based on backtesting or live trading?

The historical performance shown is based on backtesting, not actual trading in a live account. Backtesting applies the current strategy rules to historical market data to simulate how the strategy might have performed. Unless otherwise stated, backtested results generally do not fully account for commissions, bid-ask spreads, slippage, market impact, taxes, or other actual trading costs. Actual trading results may therefore differ. Backtested performance illustrates how a strategy might have behaved under past market conditions and does not guarantee similar results in the future.

What payment methods do you accept?

We currently accept credit and debit cards, including Mastercard, Visa, Discover, Apple Pay and American Express. All credit card payments are securely processed through Stripe. Your subscription renews automatically at the end of each billing period.

How do I cancel my membership?

Annual subscriptions come with a 7-day money-back guarantee. Monthly subscriptions are non-refundable. To request a refund within 7 days of purchasing an annual subscription, please contact billing@tradingkey.com.

Do the strategies constitute investment advice?

The strategies and related stock lists, portfolio weights, historical performance, and model signals are provided solely for quantitative research, market information, and strategy illustration. They should not be considered personalized recommendations to buy, sell, or hold any security. The models do not take into account your financial circumstances, investment objectives, risk tolerance, or investment horizon. All investments involve risk. Stock prices may rise or fall, and neither historical performance nor model signals guarantee future results. Before making investment decisions, exercise independent judgment based on your own circumstances and consult a qualified professional if needed.

tradingkey.logotradingkey.logo
Risk Warning: Our Website and Mobile App provides only general information on certain investment products. Finsights does not provide, and the provision of such information must not be construed as Finsights providing, financial advice or recommendation for any investment product.
Investment products are subject to significant investment risks, including the possible loss of the principal amount invested and may not be suitable for everyone. Past performance of investment products is not indicative of their future performance.
Finsights may allow third party advertisers or affiliates to place or deliver advertisements on our Website or Mobile App or any part thereof and may be compensated by them based on your interaction with the advertisements.
© Copyright: FINSIGHTS MEDIA PTE. LTD. All Rights Reserved.