


 Discount


Nextracker Inc Stock (NXT) Moved Down by 11.29% on Nov 17: Drivers Behind the Movement


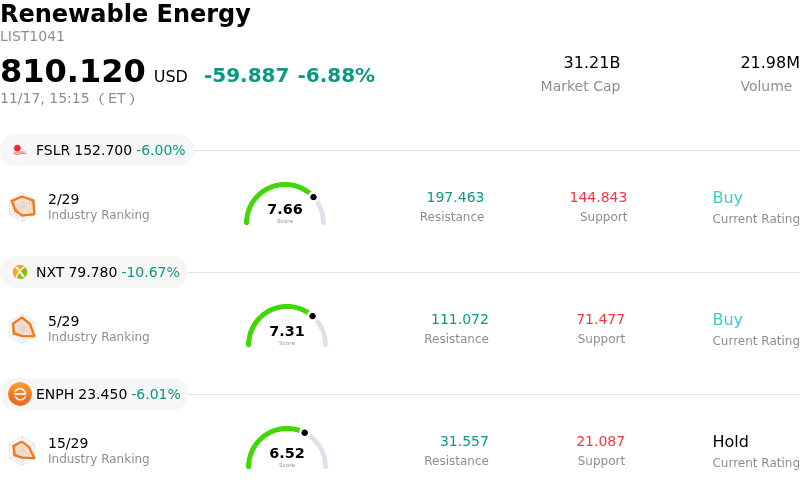
Nextracker Inc (NXT) moved down by 11.29%. The Renewable Energy sector is down by 6.88%. The company underperformed the industry. Top 3 stocks by turnover in the sector: First Solar Inc (FSLR) down 6.00%; Nextracker Inc (NXT) down 10.67%; Enphase Energy Inc (ENPH) down 6.01%.
What is driving Nextracker Inc (NXT)’s stock price down today?
Shares of Nextpower experienced pronounced downward pressure during intraday trading as investors absorbed updates from the company’s recent Capital Markets Day alongside fresh Wall Street research adjustments. While management outlined ambitious multi-year revenue expansion targets and underscored a robust utility-scale project backlog, the presentation prompted institutional scrutiny regarding the near-term margin trajectory, execution complexity, and capital intensity required to support the company’s ongoing transition from a pure-play solar tracker manufacturer into a broader power technology and energy platform.
A primary catalyst for the retreat stems from growing apprehension over margin sustainability. Although top-line volume growth remains supported by global renewable energy demand, recent reporting periods have revealed margin compression driven by elevated input costs, tariff adjustments, and the integration of acquired product lines such as electrical balance-of-systems, energy storage, and power conversion solutions. These newer adjacent offerings, while expanding the addressable market, initially carry lower margin profiles relative to core tracker hardware. Following the corporate presentation, several research analysts lowered their price targets on the equity, highlighting concerns that near-term earnings conversion and free cash flow generation may lag revenue growth as operational investments scale.
Macroeconomic and industry-specific headwinds have amplified negative market sentiment across clean energy equipment providers. Utility-scale solar deployments continue to navigate persistent grid interconnection bottlenecks, project delivery timing shifts, and uncertainties surrounding the long-term application of manufacturing tax credits and domestic content rules. In an environment where broader market positioning remains cautious toward capital-intensive green technology suppliers, institutional portfolio managers appear to be de-risking positions and rotating capital away from high-multiple growth names that show signs of decelerating margin expansion.
The selloff highlights a market recalibration where heightened expectations collide with near-term execution hurdles. While the company maintains a debt-free balance sheet and deep commercial relationships with engineering, procurement, and construction contractors, sustained stabilization in the stock will largely depend on management’s ability to defend operating margins, demonstrate synergy realization across recent acquisitions, and navigate project timing volatility in the quarters ahead.
Technical Analysis of Nextracker Inc (NXT)
Technically, Nextracker Inc (NXT) shows a MACD (12,26,9) value of -2.475, indicating a neutral signal. The RSI at 40.666 suggests neutral condition and the Williams %R at 91.719 suggests oversold condition. Please monitor closely.
Fundamental Analysis of Nextracker Inc (NXT)
Nextracker Inc (NXT) is in the Renewable Energy industry. Its latest annual revenue is $3.56B, ranking 4 in the industry. The net profit is $585.88M, ranking 2 in the industry. Company Profile
Over the past month, multiple analysts have rated the company as Buy, with an average price target of $128.98, a high of $164.00, and a low of $72.39.
More details about Nextracker Inc (NXT)
Company Specific Risks:
- Capital Markets Day Margin Guidance Disappointment: Management's updates at the November 16 Capital Markets Day signaled that fiscal 2028 margins and profitability will face substantial dilution due to an extended investment cycle in non-tracker product categories, delaying anticipated operating leverage into fiscal 2029–2030.
- Institutional EBITDA and Earnings Estimate Reductions: Following the company's long-term framework presentation, Wall Street analysts sharply reset financial expectations, headlined by BMO Capital cutting fiscal 2028 EBITDA and EPS estimates by approximately 15% and 16% and lowering its price target amid a broader wave of analyst estimate cuts.
- Accelerating Product Mix Gross Margin Compression: Rapid portfolio diversification into power electronics, inverters, and integrated energy storage through recent acquisitions continues to dilute consolidated gross margins, which recently contracted sequentially to 32% from 36.6% due to higher component costs and lower-margin hardware.
- High Customer Concentration Among Cost-Sensitive EPC Contractors: Approximately 75% of revenue remains tied to utility-scale Engineering, Procurement, and Construction (EPC) firms that exhibit low brand stickiness, exposing the business to pricing concession pressures and contract pushouts as developers navigate elevated financing costs.
This article may include AI-generated content that is human-reviewed, which is for reference and general information purposes only and does not constitute investment advice.
Recommended Articles









Comments (0)
Click the $ button, enter the symbol, and select to link a stock, ETF, or other ticker.