


CVS Health Corp Stock (CVS) Moved Down by 3.26% on Nov 17: What Signal Does It Send?


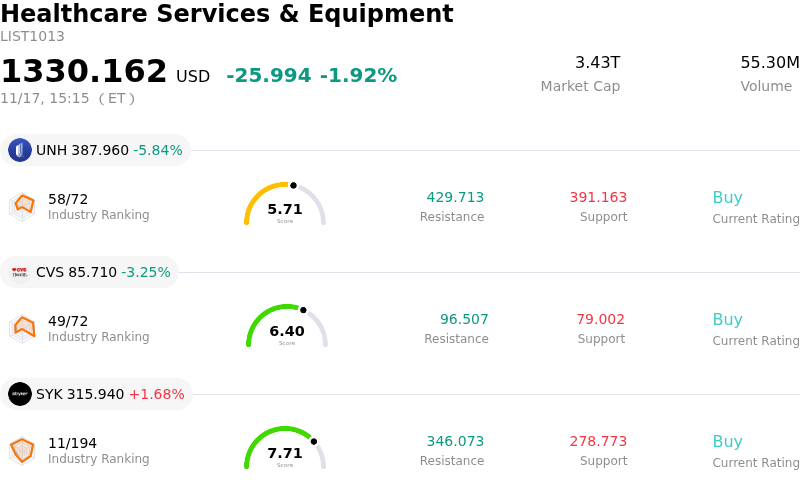
CVS Health Corp (CVS) moved down by 3.26%. The Healthcare Services & Equipment sector is down by 1.92%. The company underperformed the industry. Top 3 stocks by turnover in the sector: Unitedhealth Group Inc (UNH) down 5.84%; CVS Health Corp (CVS) down 3.23%; Stryker Corp (SYK) up 1.68%.
What is driving CVS Health Corp (CVS)’s stock price down today?
CVS Health experienced downward pressure during today's trading session, driven primarily by persistent investor apprehension surrounding medical cost trends within its managed care division and ongoing structural headwinds across the retail pharmacy landscape. As a diversified healthcare conglomerate, the company's valuation remains heavily sensitive to utilization patterns within its Aetna health benefits business. Elevated outpatient procedure volumes, persistent care utilization among Medicare Advantage beneficiaries, and tightened government reimbursement rates continue to weigh on the broader managed care landscape, dampening short-term margin visibility and prompting a defensive rotation away from health insurance equities.
Compounding the pressure on the healthcare benefits side, the pharmacy services and retail segments face sustained industry-specific friction. Regulatory scrutiny on pharmacy benefit managers, particularly regarding drug pricing transparency and contractual structures, has maintained an overhang across the pharmacy services segment. At the same time, the retail and consumer wellness footprint continues to navigate pharmacy reimbursement compression alongside softer front-of-store discretionary spending. This combination of operational friction and sticky overhead costs has tempered institutional expectations for near-term bottom-line margin expansion.
From an institutional portfolio perspective, sentiment remains constrained by uncertainty regarding the company's multi-year earnings recovery trajectory. Asset managers are actively reassessing risk-reward profiles across the healthcare sector, showing a preference for names with cleaner near-term cash flow predictability over those undergoing operational turnarounds. While CVS continues to implement targeted repricing strategies in its government-sponsored plans and multi-year cost containment initiatives, the market continues to demand clearer evidence of sustained medical benefit ratio stabilization before re-rating the equity.
Technical Analysis of CVS Health Corp (CVS)
Technically, CVS Health Corp (CVS) shows a MACD (12,26,9) value of 0.062, indicating a neutral signal. The RSI at 43.875 suggests neutral condition and the Williams %R at 42.613 suggests buy condition. Please monitor closely.
Media Coverage of CVS Health Corp (CVS)
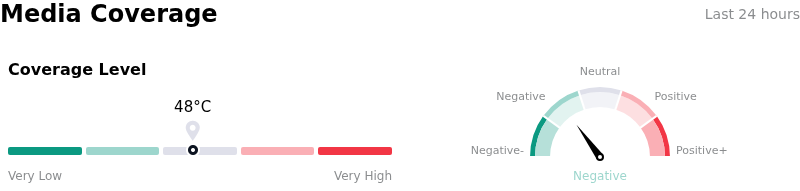
In terms of media coverage, CVS Health Corp (CVS) shows a coverage score of 48, indicating a moderate level of media attention. The overall market sentiment index is currently in bearish zone.
Fundamental Analysis of CVS Health Corp (CVS)
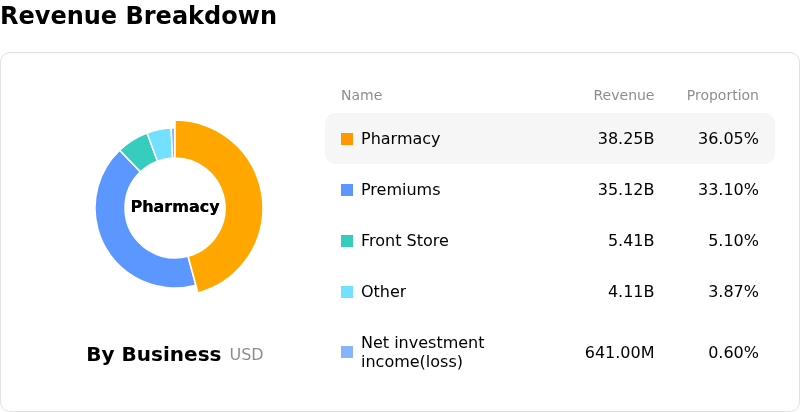
CVS Health Corp (CVS) is in the Healthcare Services & Equipment industry. Its latest annual revenue is $402.07B, ranking 2 in the industry. The net profit is $1.77B, ranking 5 in the industry. Company Profile
Over the past month, multiple analysts have rated the company as Buy, with an average price target of $111.25, a high of $123.00, and a low of $94.96.
More details about CVS Health Corp (CVS)
Company Specific Risks:
- Corporate Separation Execution and Dis-Synergy Headwinds: Market volatility surrounding the multi-year plan to split retail pharmacy operations from Aetna and Caremark intensified following an RBC Capital price target cut to $108, which cited operational dis-synergies, corporate overhead duplication, and sustained restructuring execution risks.
- Heightened Regulatory and Antitrust Scrutiny: Congressional calls renewed scrutiny on vertically integrated healthcare conglomerates combining insurers, pharmacy benefit managers (PBMs), and retail pharmacies, amplifying concerns that CVS’s corporate split is a defensive reaction to impending regulatory probes rather than a value-accretive operational shift.
- GLP-1 Cost Inflation and Margin Compression: Newly released internal healthcare cost analysis demonstrated that elevated prescription spending on GLP-1 drugs continues to outpace near-term medical cost savings, compounding margin vulnerability and Medical Benefit Ratio (MBR) volatility within the Health Care Benefits unit.
- Institutional Target Reductions and Technical Breakdown: Consecutive downward price target revisions from major Wall Street institutions—including RBC Capital, Wells Fargo, and Raymond James—have pressured CVS shares down nearly 4% intraday, breaching critical support levels beneath both the 20-day and 200-day moving averages.
This article may include AI-generated content that is human-reviewed, which is for reference and general information purposes only and does not constitute investment advice.
Recommended Articles








Comments (0)
Click the $ button, enter the symbol, and select to link a stock, ETF, or other ticker.