


Shopify Inc Stock (SHOP) Moved Down by 3.50% on Nov 17: What Signal Does It Send?


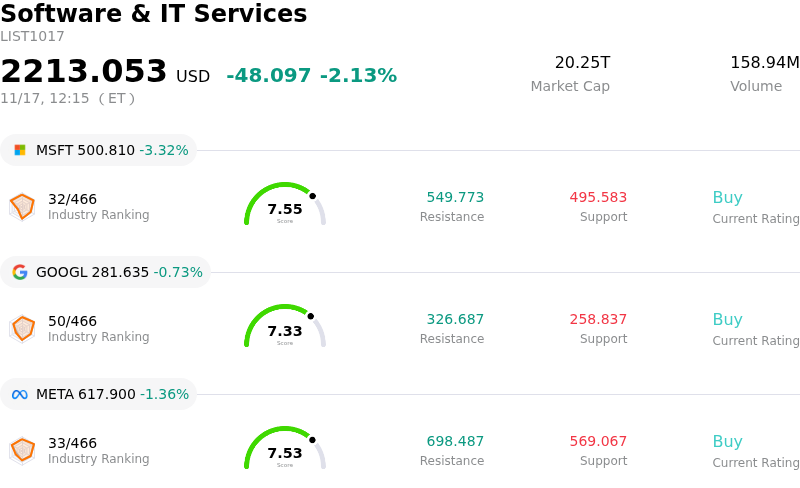
Shopify Inc (SHOP) moved down by 3.50%. The Software & IT Services sector is down by 2.13%. The company underperformed the industry. Top 3 stocks by turnover in the sector: Microsoft Corp (MSFT) down 3.42%; Alphabet Inc Class A (GOOGL) down 0.79%; Meta Platforms Inc (META) down 1.36%.
What is driving Shopify Inc (SHOP)’s stock price down today?
Shopify shares faced notable selling pressure during the session, driven by a confluence of broad-based weakness across high-multiple growth equities and mounting investor caution ahead of the critical holiday shopping window. With benchmark bond yields fluctuating in response to persistent macroeconomic crosscurrents and recalibrated interest rate expectations, long-duration technology and software platforms came under valuation scrutiny, prompting institutional market participants to systematically de-risk and rebalance exposures away from high-beta software names.
Underlying the downward movement is heightened sensitivity surrounding consumer discretionary resilience leading into the Black Friday and Cyber Monday promotional period. While merchant additions and platform scale continue to support Shopify's core ecosystem, recent market commentary and mixed retail indicators have sparked concerns over holiday demand elasticity. Investors are closely monitoring whether sustained cost-of-living pressures and selective consumer spending habits could moderate fourth-quarter Gross Merchandise Volume (GMV) expansion, directly impacting Shopify's transaction-based revenue streams within its Merchant Solutions division.
From an operational standpoint, market sentiment is also navigating questions around margin trajectory and reinvestment cycles. Following recent quarters of operational discipline and portfolio refinement, the market remains extraordinarily sensitive to any potential uptick in operating expenditures dedicated to enterprise merchant acquisition, cross-border commerce tools, and artificial intelligence integration. In an environment where the market aggressively penalizes software companies for any perceived trade-off between growth re-acceleration and free cash flow generation, elevated expectations have left little margin for operational hesitation.
Looking ahead, Shopify's short-term trajectory will largely hinge on incoming merchant performance updates through the peak holiday corridor and the broader macroeconomic backdrop governing consumer spending power. While Shopify maintains an exceptionally strong structural moat within global digital commerce infrastructure, the stock remains susceptible to valuation multiple compression whenever macro sentiment deteriorates and retail consumption trends show signs of deceleration.
Technical Analysis of Shopify Inc (SHOP)
Technically, Shopify Inc (SHOP) shows a MACD (12,26,9) value of -3.193, indicating a sell signal. The RSI at 39.484 suggests neutral condition and the Williams %R at 78.936 suggests sell condition. Please monitor closely.
Fundamental Analysis of Shopify Inc (SHOP)
Shopify Inc (SHOP) is in the Software & IT Services industry. Its latest annual revenue is $11.56B, ranking 33 in the industry. The net profit is $1.23B, ranking 41 in the industry. Company Profile
Over the past month, multiple analysts have rated the company as Buy, with an average price target of $176.65, a high of $220.00, and a low of $120.00.
More details about Shopify Inc (SHOP)
Company Specific Risks:
- Gross Margin Deceleration and Escalating Operational Costs: Forward guidance indicates that fourth-quarter gross profit growth will lag total revenue growth (projected in the high-twenties versus low-thirties revenue growth), pressured by shifts toward lower-margin merchant solutions and rising computing and infrastructure costs required to support automated commerce.
- Core Volume and Subscription Revenue Shortfall: Recent quarterly metrics revealed an execution soft spot as Gross Merchandise Volume (GMV) of $119.1 billion and subscription solutions revenue missed institutional consensus benchmarks, stoking sell-side anxiety regarding a deceleration in merchant acquisition and platform transaction velocity.
- Valuation Multiples Vulnerability: Operating at an aggressive valuation multiple near 90x forward earnings and a PEG ratio well above 3.0, the stock has triggered price target trims from firms such as Cantor Fitzgerald and DA Davidson, leaving share prices hypersensitive to minor execution misses amid tech-sector factor rotations.
- Monetization Lag in Agentic Commerce Investments: Substantial capital and developmental expenditures directed toward AI partnerships and agentic checkout capabilities are outpacing bottom-line realization, with analysts flagging that tangible returns from agentic workflows will take extended cycles to monetize while creating immediate operating margin friction.
This article may include AI-generated content that is human-reviewed, which is for reference and general information purposes only and does not constitute investment advice.
Recommended Articles








Comments (0)
Click the $ button, enter the symbol, and select to link a stock, ETF, or other ticker.