


Goldman Sachs Group Inc Stock (GS) Moved Down by 3.07% on Nov 16: Key Drivers Unveiled


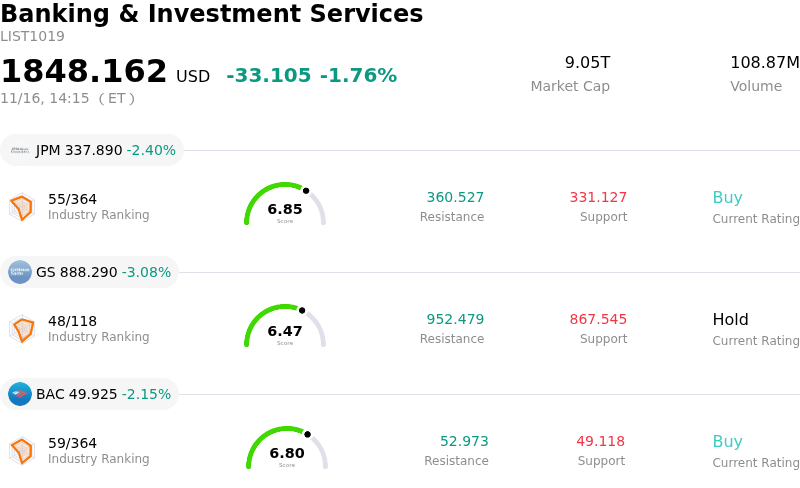
Goldman Sachs Group Inc (GS) moved down by 3.07%. The Banking & Investment Services sector is down by 1.76%. The company underperformed the industry. Top 3 stocks by turnover in the sector: JPMorgan Chase & Co (JPM) down 2.40%; Goldman Sachs Group Inc (GS) down 3.08%; Bank of America Corp (BAC) down 2.15%.
What is driving Goldman Sachs Group Inc (GS)’s stock price down today?
Goldman Sachs faced noticeable downward pressure during the session, reflecting a confluence of macroeconomic headwinds, tightening financial conditions, and sector-wide risk aversion across large-cap financial institutions. As market participants reassessed the trajectory of benchmark interest rates and the shape of the yield curve, bank equities experienced broad-based selling, with diversified investment banks bearing the brunt of the pullback. A shifting interest rate landscape and fluctuating bond yields have raised fresh questions regarding funding costs, dampening short-term investor appetite for capital-sensitive institutions.
Beyond overarching interest rate dynamics, sentiment around the investment banking pipeline played a critical role in the retreat. Goldman Sachs is heavily leveraged to global advisory, mergers and acquisitions, and capital underwriting activity. Heightened macroeconomic uncertainty and broader market turbulence have renewed concerns regarding the pace of deal execution, corporate debt issuance, and initial public offerings. Institutional investors remain cautious that elevated corporate borrowing costs could prolong the subdued recovery in advisory volumes, directly constraining fee-generating capacity across major dealmakers.
Trading operations and global market divisions also face an evolving operating backdrop. While heightened market volatility can intermittently support fixed income, currency, and commodities trading revenues, erratic swings in asset valuations and cautious institutional client engagement often create short-term friction for market-making desks. Furthermore, ongoing macroeconomic ambiguity continues to influence credit provisions and capital allocation strategies, as regulatory scrutiny surrounding capital adequacy and risk-weighted assets constrains aggressive balance sheet deployment.
From an institutional perspective, the session's weakness also aligns with systemic profit-taking and tactical portfolio rebalancing away from cyclical financial names toward defensive sectors. While Goldman Sachs maintains an industry-leading franchise, deep institutional liquidity, and solid positioning to capitalize on any sustained turnaround in global corporate activity, short-term valuation multiples remain vulnerable to macro-driven multiple compression. Near-term price action will likely hinge on incoming economic data, the resilience of corporate deal pipelines, and concrete evidence of a structural revival in cross-border transaction volumes.
Technical Analysis of Goldman Sachs Group Inc (GS)
Technically, Goldman Sachs Group Inc (GS) shows a MACD (12,26,9) value of 5.115, indicating a neutral signal. The RSI at 45.567 suggests neutral condition and the Williams %R at 60.463 suggests sell condition. Please monitor closely.
Media Coverage of Goldman Sachs Group Inc (GS)
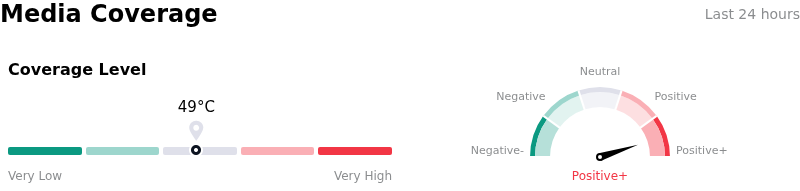
In terms of media coverage, Goldman Sachs Group Inc (GS) shows a coverage score of 49, indicating a moderate level of media attention. The overall market sentiment index is currently in extremely bullish zone.
Fundamental Analysis of Goldman Sachs Group Inc (GS)
Goldman Sachs Group Inc (GS) is in the Banking & Investment Services industry. Its latest annual revenue is $117.10B, ranking 2 in the industry. The net profit is $16.30B, ranking 1 in the industry. Company Profile
Over the past month, multiple analysts have rated the company as Hold, with an average price target of $1045.75, a high of $1250.00, and a low of $875.00.
More details about Goldman Sachs Group Inc (GS)
Company Specific Risks:
- Regulatory Capital Buffer Compression: Recent balance sheet scrutiny and analyst commentary emphasize that a 12% expansion in risk-weighted assets has compressed the firm's Common Equity Tier 1 (CET1) ratio to 12.4%, shrinking its regulatory capital cushion to roughly 100 basis points above the 11.4% requirement and threatening future capital return capacity.
- Excessive Revenue Concentration in Volatile Trading Desks: Institutional analysts have raised red flags over structural earnings quality as equities and fixed-income trading surged to account for 56% of total revenues, exposing Goldman Sachs to sharp intraday and quarterly revenue reversals once macro-driven market-making volumes normalize.
- Investment Banking Backlog Softening and FICC Stagnation: Recent deal-flow updates indicate a sequential deterioration in the firm's investment banking backlog paired with flat performance across fixed-income, currency, and commodities (FICC) operations, dampening forward fee-generation expectations.
- Surging Operating Expenses and Credit-Loss Provisions: Escalating operational overhead, marked by a 20% year-over-year rise in quarterly operating expenses and a sequential tripling of provisions for credit losses, continues to compress operating margins and erode operating leverage.
This article may include AI-generated content that is human-reviewed, which is for reference and general information purposes only and does not constitute investment advice.
Recommended Articles





Comments (0)
Click the $ button, enter the symbol, and select to link a stock, ETF, or other ticker.