


Amazon.com Inc Stock (AMZN) Moved Down by 3.16% on Nov 16: Drivers Behind the Movement


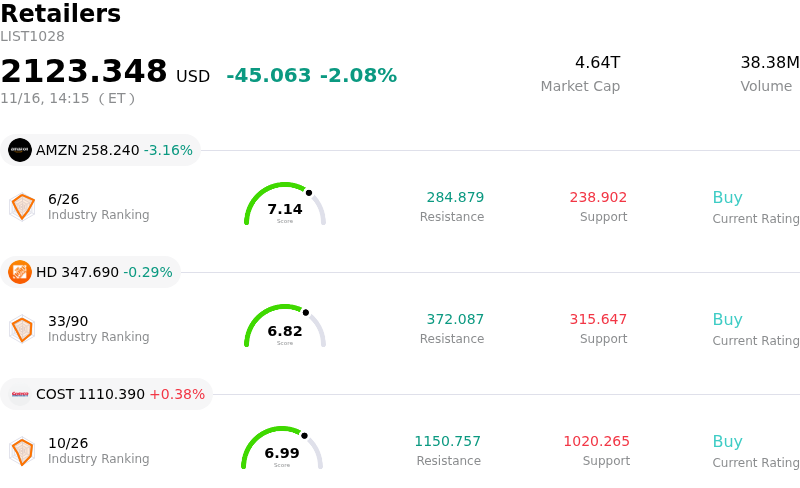
Amazon.com Inc (AMZN) moved down by 3.16%. The Retailers sector is down by 2.08%. The company underperformed the industry. Top 3 stocks by turnover in the sector: Amazon.com Inc (AMZN) down 3.16%; Home Depot Inc (HD) down 0.29%; Costco Wholesale Corp (COST) up 0.38%.
What is driving Amazon.com Inc (AMZN)’s stock price down today?
Amazon came under noticeable selling pressure during the session, tracking broader weakness across mega-cap technology and growth equities. An uptick in benchmark Treasury yields, driven by recalibrated expectations surrounding Federal Reserve monetary policy, exerted valuation pressure across high-duration assets. As broader market risk appetite softened, institutional capital rotated toward more defensive and cyclical market segments, leading to tactical profit-taking and multiple compression in mega-cap leaders that carry substantial index weighting.
Beyond macroeconomic factors, market participants continue to scrutinize the capital expenditure trajectory associated with cloud computing and artificial intelligence infrastructure. While enterprise demand for generative AI tooling and cloud migrations remains a critical secular growth engine, massive infrastructure outlays across data centers and custom silicon have raised short-term concerns regarding free cash flow conversion and operating margins within Amazon Web Services. Heightened competitive pressure from competing hyper-scalers has further amplified investor sensitivity around the timeline required to translate elevated capital spending into accelerated operating leverage.
Within the core retail and logistics operations, market sentiment was tempered by caution regarding consumer resilience heading into the peak holiday shopping period. Mixed signals surrounding discretionary consumer spending, persistent cost-of-living pressures, and heightened price sensitivity have cast uncertainty over average order values and retail volume growth. Additionally, ongoing promotional intensity and fulfillment network investments present potential near-term friction for retail segment profitability. The session's pullback primarily reflects broader institutional de-risking and valuation scrutiny ahead of key consumer retail benchmarks, with medium-term sentiment dependent on cloud margin stability and holiday sales execution.
Technical Analysis of Amazon.com Inc (AMZN)
Technically, Amazon.com Inc (AMZN) shows a MACD (12,26,9) value of 1.853, indicating a buy signal. The RSI at 50.050 suggests neutral condition and the Williams %R at 37.062 suggests buy condition. Please monitor closely.
Media Coverage of Amazon.com Inc (AMZN)
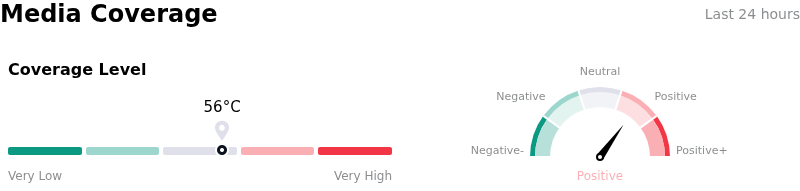
In terms of media coverage, Amazon.com Inc (AMZN) shows a coverage score of 56, indicating a moderate level of media attention. The overall market sentiment index is currently in bullish zone.
Fundamental Analysis of Amazon.com Inc (AMZN)
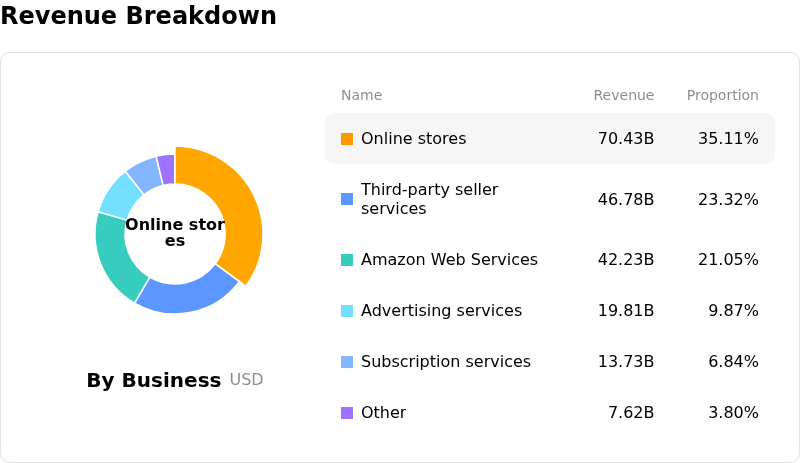
Amazon.com Inc (AMZN) is in the Retailers industry. Its latest annual revenue is $716.92B, ranking 1 in the industry. The net profit is $77.67B, ranking 1 in the industry. Company Profile
Over the past month, multiple analysts have rated the company as Buy, with an average price target of $323.05, a high of $405.00, and a low of $207.00.
More details about Amazon.com Inc (AMZN)
Company Specific Risks:
- Project Leo Satellite Constellation Loss: The failure of a United Launch Alliance Vulcan rocket resulted in the loss of 40 Project Leo broadband satellites on the first of 38 contracted flights, creating immediate operational setbacks and timeline uncertainty for Amazon's multi-billion-dollar satellite deployment and FCC regulatory commitments.
- Cash Flow Depletion from AI Capital Expenditures: Surging infrastructure investments totaling roughly $220 billion have pushed trailing free cash flow to a $42 billion deficit and expanded debt obligations, triggering institutional analyst concerns regarding capital efficiency and long-term returns on generative AI build-outs.
- Core Retail and Advertising Revenue Deceleration: Recent analyst scrutiny emphasizes marked deceleration across high-margin business units, with online retail sales growth slowing to 2% and digital advertising growth declining to 12%, intensifying margin pressure ahead of the peak holiday shopping quarter.
- Regional Opposition to Data Center Expansion: AWS infrastructure scaling faces heightened execution and regulatory hurdles, evidenced by community pushback and calls for building moratoriums in Eastern Washington over excessive utility grid strain and local water consumption.
This article may include AI-generated content that is human-reviewed, which is for reference and general information purposes only and does not constitute investment advice.
Recommended Articles








Comments (0)
Click the $ button, enter the symbol, and select to link a stock, ETF, or other ticker.