


Interactive Brokers Group Inc Stock (IBKR) Moved Down by 3.29% on Nov 16: A Full Analysis


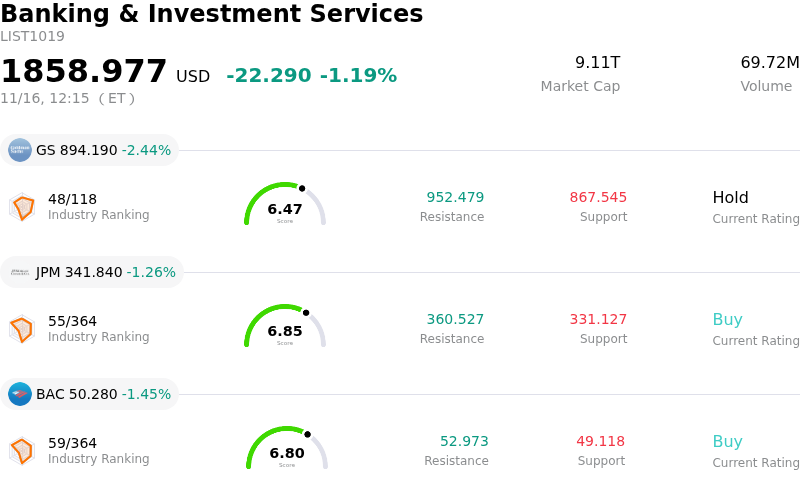
Interactive Brokers Group Inc (IBKR) moved down by 3.29%. The Banking & Investment Services sector is down by 1.19%. The company underperformed the industry. Top 3 stocks by turnover in the sector: Goldman Sachs Group Inc (GS) down 2.48%; JPMorgan Chase & Co (JPM) down 1.27%; Bank of America Corp (BAC) down 1.45%.
What is driving Interactive Brokers Group Inc (IBKR)’s stock price down today?
Interactive Brokers is experiencing notable downward pressure, primarily driven by macroeconomic headwinds surrounding monetary policy and net interest margin expectations, alongside broader weakness across retail and electronic brokerage equities. As an institution where net interest income represents a substantial portion of overall net revenues, the firm's earnings sensitivity to benchmark rate expectations remains exceptionally high. Shifting consensus toward a more accommodative Federal Reserve trajectory and lower benchmark yields has led market participants to re-evaluate near-term net interest income expansion, creating headwinds for the brokerage's earnings outlook.
In addition to rate sensitivity, short-term deceleration in market-wide trading engagement has added to negative sentiment. Institutional and retail trading activity, as measured by daily average revenue trades, faces cyclical normalization following periods of elevated market participation. Softer volumes across derivative products and equities reduce transactional commission momentum, prompting some institutional investors to scale back near-term growth assumptions. When coupled with a modest moderation in margin lending balances as clients trim portfolio leverage amidst market uncertainty, revenue generation across both financing and trading operations experiences pressure.
From a portfolio allocation and market strategy standpoint, the retreat also reflects profit-taking and multiple compression across financial technology and broker-dealer shares. Interactive Brokers had enjoyed premium valuation multiples relative to traditional investment managers, leaving the shares vulnerable to tactical rebalancing as institutional investors rotate toward defensive, less rate-sensitive sectors. Ongoing competitive dynamics in pricing, interest yields on idle client cash, and execution platforms further elevate operational margin scrutiny.
Despite these near-term headwinds, Interactive Brokers retains solid structural advantages, including industry-leading technological efficiency, a disciplined risk-management framework, and sustained global client account additions. However, until benchmark yield curves stabilize and broader trading momentum reaccelerates, the stock remains exposed to heightened sensitivity around monetary easing cycles and shifting risk appetites across capital markets.
Technical Analysis of Interactive Brokers Group Inc (IBKR)
Technically, Interactive Brokers Group Inc (IBKR) shows a MACD (12,26,9) value of 1.311, indicating a neutral signal. The RSI at 46.139 suggests neutral condition and the Williams %R at 37.923 suggests buy condition. Please monitor closely.
Media Coverage of Interactive Brokers Group Inc (IBKR)
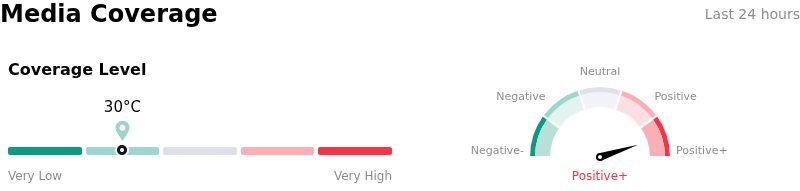
In terms of media coverage, Interactive Brokers Group Inc (IBKR) shows a coverage score of 30, indicating a low level of media attention. The overall market sentiment index is currently in extremely bullish zone.
Fundamental Analysis of Interactive Brokers Group Inc (IBKR)
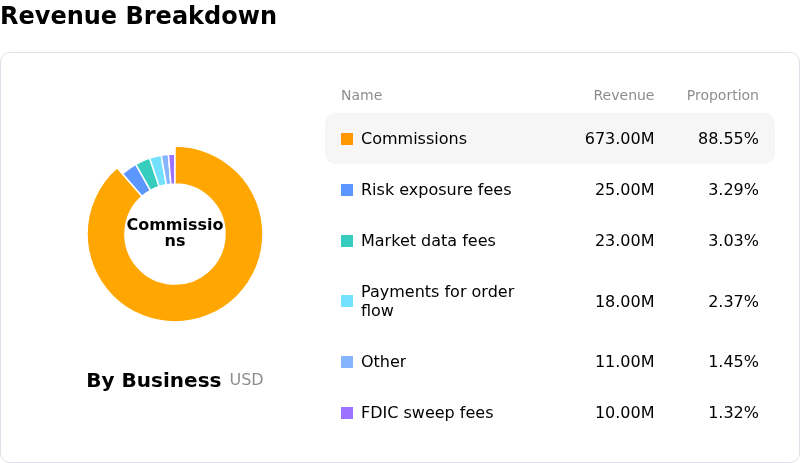
Interactive Brokers Group Inc (IBKR) is in the Banking & Investment Services industry. Its latest annual revenue is $10.00B, ranking 24 in the industry. The net profit is $984.00M, ranking 25 in the industry. Company Profile
Over the past month, multiple analysts have rated the company as Buy, with an average price target of $103.74, a high of $120.00, and a low of $73.19.
More details about Interactive Brokers Group Inc (IBKR)
Company Specific Risks:
- DARTs Deceleration and Per-Account Engagement Drag: Recent monthly brokerage performance metrics and analyst reviews highlight a 4% year-over-year contraction in Daily Average Revenue Trades (DARTs) alongside softening commission revenue per cleared order, demonstrating that active trading frequency is failing to match account expansion and leaving transaction revenue vulnerable to downward revisions.
- Pretax Margin Compression from Regulatory and Clearing Expenses: Institutional analysts are focusing on operational margin erosion, as pretax margins have moderated from peak levels due to higher execution and clearing expenditures, as well as rising SEC Section 31 regulatory transaction fee burdens that dilute the firm's technological operating leverage.
- Net Interest Income Exposure to Rate Repricing: With net interest income accounting for roughly 60% of total net revenues, ongoing volatility across the yield curve and shifting monetary policy expectations create downside earnings risk if margin loan balances face headwinds or spreads on client credit cash deposits compress.
- Multiple Compression Risk from Premium Valuation: Trading near 31 times earnings—an elevated multiple compared to traditional custody and brokerage peers—the stock suffers from heightened intraday volatility and reduced valuation buffers, leaving it acutely exposed to institutional selling during market-wide risk-off rotations.
This article may include AI-generated content that is human-reviewed, which is for reference and general information purposes only and does not constitute investment advice.
Recommended Articles







Comments (0)
Click the $ button, enter the symbol, and select to link a stock, ETF, or other ticker.