


AbbVie Inc Stock (ABBV) Closed Up by 3.09% on Nov 4: Key Drivers Unveiled


AbbVie Inc (ABBV) closed up by 3.09%. The Pharmaceuticals & Medical Research sector is up by 2.86%. The company outperformed the industry. Top 3 stocks by turnover in the sector: Eli Lilly and Co (LLY) up 0.59%; Johnson & Johnson (JNJ) up 3.81%; AbbVie Inc (ABBV) up 3.09%.

What is driving AbbVie Inc (ABBV)’s stock price up today?
AbbVie experienced strong upward momentum accompanied by heightened intraday volatility as market participants reacted to a series of positive fundamental developments and favorable analyst revisions. The primary catalyst driving buying interest is the company's robust quarterly financial performance, where revenue and adjusted earnings per share comfortably exceeded Wall Street consensus. Management subsequently raised full-year earnings and revenue guidance, reinforcing investor confidence in the company's long-term growth trajectory.
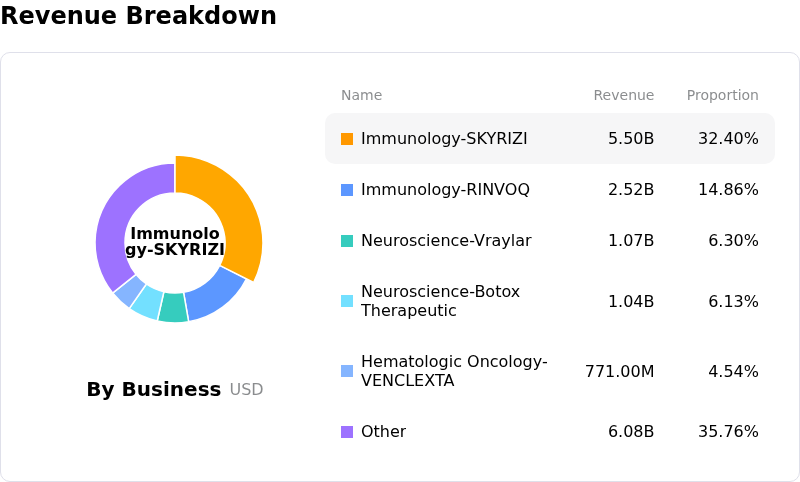
A central pillar supporting institutional sentiment is the exceptional commercial trajectory of AbbVie's primary growth engines, Skyrizi and Rinvoq. Both therapies registered strong double-digit sales expansion, demonstrating that the post-Humira revenue transition has successfully materialized. The immunology portfolio has been further fortified by key regulatory milestones, including expanded label approvals for Skyrizi in Crohn's disease. Additionally, the neuroscience portfolio continues to show robust operational strength, led by solid growth across Vraylar and Qulipta.
Beyond core earnings, strategic business development activities have added upside optionality to AbbVie's long-term pipeline. The company recently entered into a global licensing deal with Brise Pharmaceuticals to develop next-generation migraine candidates while advancing strategic pipeline additions through acquisitions. Capital allocation also remains attractive to investors, as management announced another increase to its quarterly dividend, reinforcing its commitment to shareholder returns and highlighting resilient cash flow generation.
Following the quarterly print and updated outlook, several major Wall Street firms raised their price targets on the stock, reflecting heightened confidence in management's execution. Favorable sentiment has also been aided by institutional portfolio adjustments and sector rotation into defensive healthcare leaders amid broader market rebalancing. While intraday volatility reflects brief profit-taking and valuation adjustments following recent gains, the overarching trajectory remains supported by solid fundamentals and therapeutic market leadership.
Technical Analysis of AbbVie Inc (ABBV)
Technically, AbbVie Inc (ABBV) shows a MACD (12,26,9) value of -0.124, indicating a neutral signal. The RSI at 66.147 suggests neutral condition and the Williams %R at 18.862 suggests overbought condition. Please monitor closely.
Fundamental Analysis of AbbVie Inc (ABBV)
AbbVie Inc (ABBV) is in the Pharmaceuticals & Medical Research industry. Its latest annual revenue is $61.16B, ranking 7 in the industry. The net profit is $4.19B, ranking 15 in the industry. Company Profile
Over the past month, multiple analysts have rated the company as Buy, with an average price target of $295.00, a high of $350.00, and a low of $197.05.
More details about AbbVie Inc (ABBV)
Company Specific Risks:
- Sub-Consensus Q4 Earnings Guidance: Despite reporting a third-quarter earnings beat, AbbVie issued fourth-quarter adjusted EPS guidance of $3.83 to $3.87, coming in below Wall Street consensus estimates of $3.89; this softer near-term outlook triggered profit-taking and downside pressure as shares traded down from record high levels.
- High Revenue Concentration in Key Immunology Assets: As Humira revenues fell 31.2% year-over-year due to ongoing biosimilar erosion, nearly half of total net revenues (48.7%) now depends strictly on Skyrizi and Rinvoq, exacerbating top-line vulnerability to potential pricing pressure, patent challenges, or commercial headwinds on these two core replacement drugs.
- Government Price Negotiations Dragging Oncology Revenues: Third-quarter oncology revenue growth stalled at just 0.8% year-over-year, severely dragged down by a 26.1% drop in Imbruvica sales following the implementation of Medicare maximum fair price caps under the Inflation Reduction Act, demonstrating direct regulatory risk to key legacy franchises.
- Stretched Valuation Multiples and High Debt Burden: Wall Street analysts flagged downside vulnerability stemming from a demanding valuation (trading above 49x GAAP TTM EPS) alongside substantial debt obligations ($70.8 billion in debt plus $10 billion in recent note issuances for acquisitions) that leave stockholders' equity in negative territory (-$5.9 billion).
This article may include AI-generated content that is human-reviewed, which is for reference and general information purposes only and does not constitute investment advice.
Recommended Articles








Comments (0)
Click the $ button, enter the symbol, and select to link a stock, ETF, or other ticker.