


Berkshire Hathaway Inc Stock (BRKa) Moved Up by 3.17% on Nov 4: Facts Behind the Movement


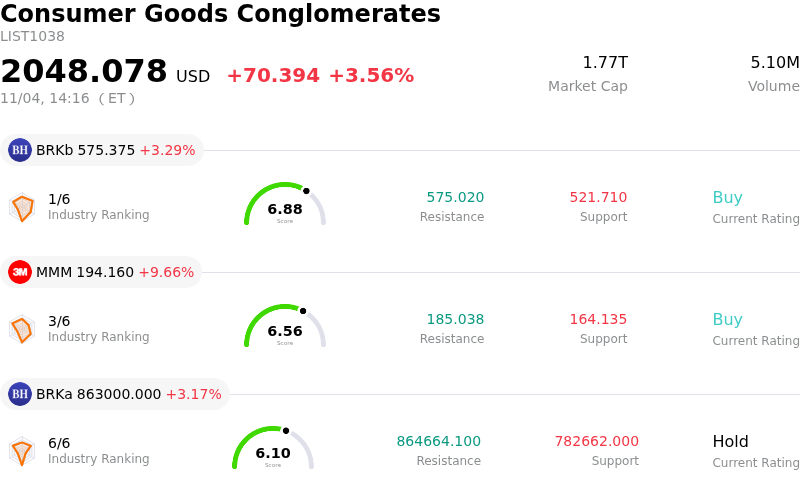
Berkshire Hathaway Inc (BRKa) moved up by 3.17%. The Consumer Goods Conglomerates sector is up by 3.56%. The company underperformed the industry. Top 3 stocks by turnover in the sector: Berkshire Hathaway Inc (BRKb) up 3.29%; 3M Co (MMM) up 9.66%; Berkshire Hathaway Inc (BRKa) up 3.17%.
What is driving Berkshire Hathaway Inc (BRKa)’s stock price up today?
Berkshire Hathaway Class A shares advanced notably amid heightened trading volatility, driven primarily by pre-earnings positioning and favorable institutional sentiment ahead of the company's upcoming quarterly financial report. Investors are anticipating solid core operating performance, underpinned by strength in non-insurance segments such as energy, utilities, and freight transportation. Additionally, elevated net investment income from the conglomerate's substantial fixed-income portfolio continues to provide a sturdy cash flow foundation, offsetting competitive pricing pressures within certain insurance underwriting channels.
Market confidence has also been bolstered by management's proactive capital allocation strategy. The company's recent shifts toward deploying uncommitted cash reserves into strategic equity positions and resuming share repurchases signal management's conviction in intrinsic business value. Positive financial results from core portfolio holdings have further reinforced the underlying asset valuation of Berkshire's investment balance sheet, reassuring institutional market participants regarding long-term earnings durability.
From a trading mechanics perspective, Class A shares naturally exhibit pronounced intraday volatility due to their unique liquidity profile. Given the extremely high individual share price and lower daily turnover compared to Class B shares, even moderate surges in institutional buying volume can lead to sharp upward intraday price swings. Macroeconomic headwinds and market-wide sector rotations toward high-quality, balance-sheet-defensive conglomerates have accelerated capital inflows into Berkshire as a dependable store of value.
Overall, today's upward price trajectory reflects a confluence of pre-earnings optimism, executive execution in capital deployment, and broad institutional demand for defensive value equities. Investors will remain tuned to the official quarterly filing to evaluate operating earnings trends, cash hoard adjustments, and future share buyback velocity.
Technical Analysis of Berkshire Hathaway Inc (BRKa)
Technically, Berkshire Hathaway Inc (BRKa) shows a MACD (12,26,9) value of 7751.799, indicating a buy signal. The RSI at 81.327 suggests overbought condition and the Williams %R at 0.000 suggests overbought condition. Please monitor closely.
Fundamental Analysis of Berkshire Hathaway Inc (BRKa)
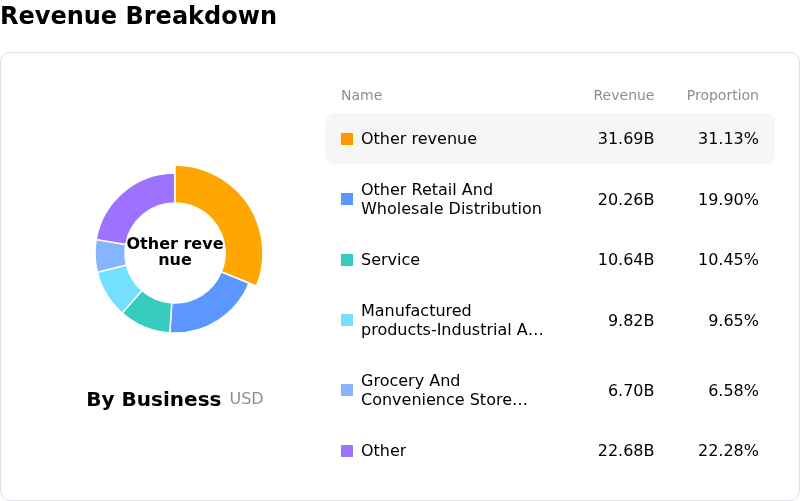
Berkshire Hathaway Inc (BRKa) is in the Consumer Goods Conglomerates industry. Its latest annual revenue is $371.44B, ranking 2 in the industry. The net profit is $66.97B, ranking 2 in the industry. Company Profile
Over the past month, multiple analysts have rated the company as Hold, with an average price target of $823135.00, a high of $942405.00, and a low of $735000.00.
More details about Berkshire Hathaway Inc (BRKa)
Company Specific Risks:
- PacifiCorp Wildfire Litigation Exposure: Berkshire Hathaway Energy faces severe ongoing liabilities and legal claims stemming from 2020 Oregon wildfire damage suits against PacifiCorp, forcing recurring multibillion-dollar litigation reserves that constrain energy segment cash flows.
- Equity Investment Impairments and Volatility: Multi-quarter net stock liquidations, valuation drawdowns in key tech holdings like Alphabet, and prior non-cash impairments in major stakes leave investment profits vulnerable to equity market pullbacks.
- Retailing Segment Earnings Contraction: Softening consumer demand and elevated operating costs across non-automotive retail subsidiaries have led to double-digit pretax earnings declines, signaling fundamental pressure on consumer-facing operating units.
- Cash Allocation and Reinvestment Drag: Holding a record cash pile exceeding $365 billion combined with paused share repurchases exposes the conglomerate to asset yield drag and capital deployment risks as analysts forecast multi-year operating profit headwinds.
This article may include AI-generated content that is human-reviewed, which is for reference and general information purposes only and does not constitute investment advice.
Recommended Articles








Comments (0)
Click the $ button, enter the symbol, and select to link a stock, ETF, or other ticker.