


Johnson & Johnson Stock (JNJ) Moved Up by 3.54% on Nov 4: A Full Analysis


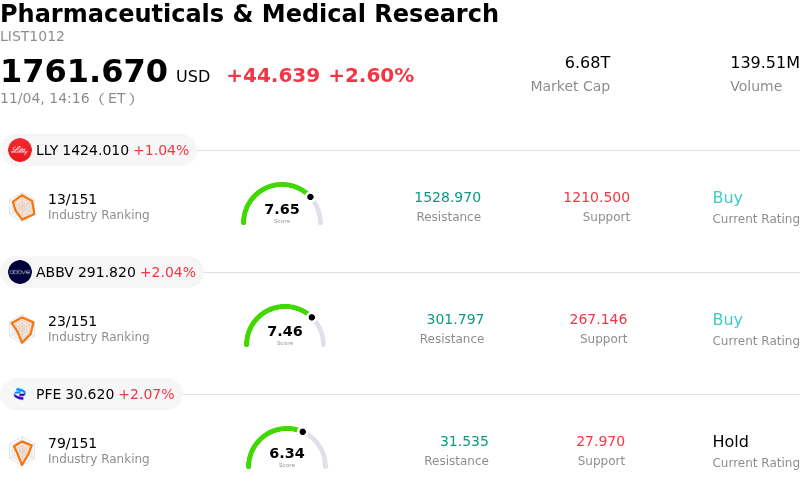
Johnson & Johnson (JNJ) moved up by 3.54%. The Pharmaceuticals & Medical Research sector is up by 2.60%. The company outperformed the industry. Top 3 stocks by turnover in the sector: Eli Lilly and Co (LLY) up 1.04%; AbbVie Inc (ABBV) up 2.04%; Pfizer Inc (PFE) up 2.07%.
What is driving Johnson & Johnson (JNJ)’s stock price up today?
Johnson & Johnson experienced positive market momentum following encouraging clinical trial updates across its MedTech and oncology portfolios presented at recent medical symposiums. Breakthrough data presented at the Transcatheter Cardiovascular Therapeutics conference demonstrated reduced mortality and high procedural success for the company's Impella heart pump platform during complex coronary interventions. Concurrently, new phase trial readouts detailing promising anti-tumor responses from its RIPTAC targeted therapy platform strengthened confidence in the growth potential of the Innovative Medicine pipeline, helping offset concerns regarding patent expirations on older therapies.
This clinical progress reinforces a solid fundamental outlook established by recent financial results. Johnson & Johnson exceeded analyst earnings forecasts in its latest quarterly report while sustaining mid-single-digit top-line revenue expansion. Management reaffirmed full-year earnings guidance and announced its ongoing quarterly dividend payout, emphasizing the company's resilient cash flow generation and defensive balance sheet. In an environment characterized by broader macroeconomic uncertainty, the healthcare giant continues to attract quality-seeking capital drawn to stable earnings visibility and consistent capital returns.
Institutional positioning and market strategy also provided strong support for the equity's upward trajectory. Recent regulatory filings highlighted notable stake increases from institutional asset managers, reflecting growing buy-side confidence in the execution of management's long-term commercial strategy. As litigation overhangs gradually clear and Wall Street maintains a favorable outlook on the company's core franchises, these converging factors generated clear buying pressure and fueled strong trading activity.
Technical Analysis of Johnson & Johnson (JNJ)
Technically, Johnson & Johnson (JNJ) shows a MACD (12,26,9) value of 2.921, indicating a buy signal. The RSI at 60.120 suggests neutral condition and the Williams %R at 21.350 suggests buy condition. Please monitor closely.
Media Coverage of Johnson & Johnson (JNJ)
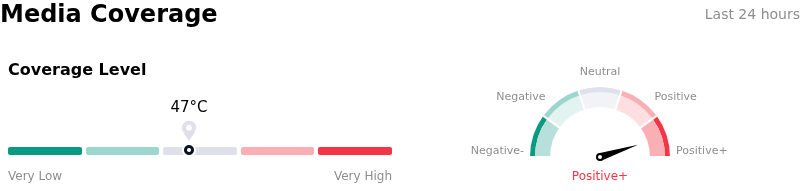
In terms of media coverage, Johnson & Johnson (JNJ) shows a coverage score of 47, indicating a moderate level of media attention. The overall market sentiment index is currently in extremely bullish zone.
Fundamental Analysis of Johnson & Johnson (JNJ)
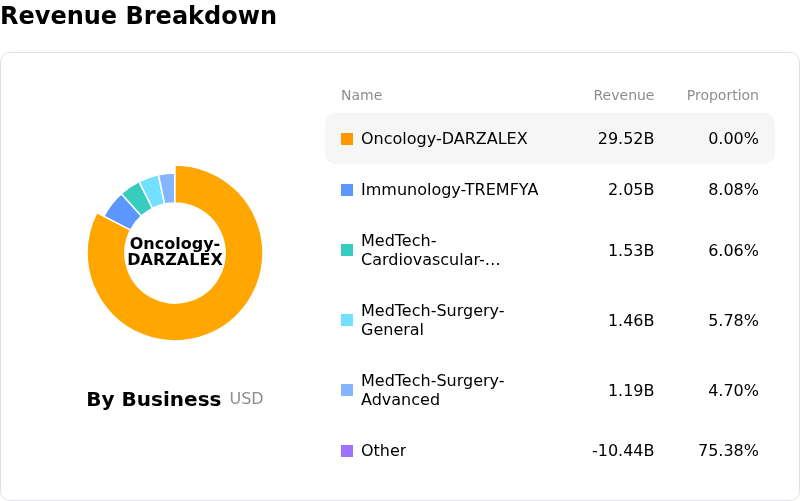
Johnson & Johnson (JNJ) is in the Pharmaceuticals & Medical Research industry. Its latest annual revenue is $94.19B, ranking 3 in the industry. The net profit is $26.80B, ranking 1 in the industry. Company Profile
Over the past month, multiple analysts have rated the company as Buy, with an average price target of $274.76, a high of $320.00, and a low of $170.00.
More details about Johnson & Johnson (JNJ)
Company Specific Risks:
- Talc Litigation Charges and Settlement Contingencies: Johnson & Johnson faces severe legal liabilities from nearly 70,000 multidistrict talcum powder lawsuits, where a massive litigation charge triggered a 95.9% year-over-year collapse in third-quarter GAAP net earnings. Furthermore, the company's proposed $5.5 billion settlement remains subject to a strict 95% claimant opt-in requirement, leaving cash flows exposed if the deal fails to finalize.
- Imminent $4.5 Billion Patent Cliff: Management faces a substantial revenue drag approaching in 2027, with an estimated $4.0 billion to $4.5 billion in annual sales losing exclusivity, primarily driven by generic exposure for key blockbusters like Xarelto (~$2.0 billion) and the pulmonary arterial hypertension franchise (~$1.5 billion).
- Acquisition R&D Charges and Multi-Year EPS Dilution: Strategic business development deals, including the Firefly Bio acquisition and Sail Biomedicines collaboration, are placing significant friction on profitability, driving a $0.64 per share dilution to FY2026 earnings and an estimated $1.36 per share dilution in FY2027 depending on milestone achievements.
- MedTech Segment Underperformance and Clinical Scrutiny: The MedTech unit continues to weigh on broader corporate growth due to sluggish performance and ongoing clinical evaluation surrounding key assets like Impella heart pumps, where market adoption remains dependent on pending clinical trial outcomes.
This article may include AI-generated content that is human-reviewed, which is for reference and general information purposes only and does not constitute investment advice.
Recommended Articles








Comments (0)
Click the $ button, enter the symbol, and select to link a stock, ETF, or other ticker.