


Novartis AG Stock (NVS) Moved Up by 3.34% on Nov 4: A Full Analysis


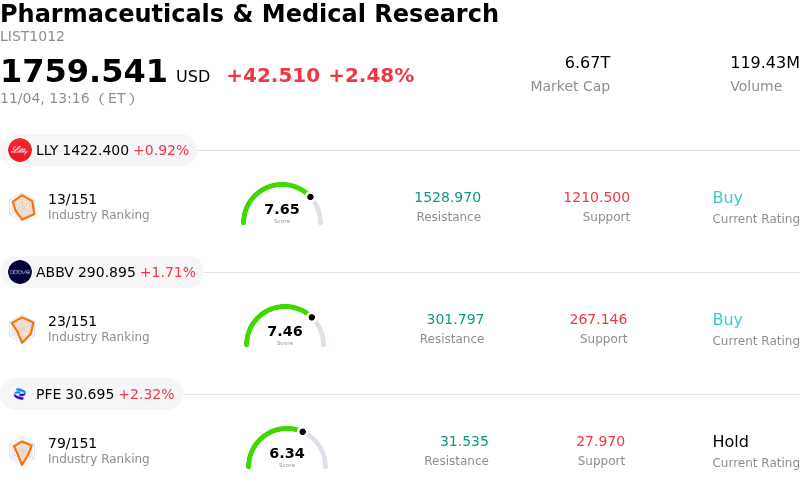
Novartis AG (NVS) moved up by 3.34%. The Pharmaceuticals & Medical Research sector is up by 2.48%. The company outperformed the industry. Top 3 stocks by turnover in the sector: Eli Lilly and Co (LLY) up 0.92%; AbbVie Inc (ABBV) up 1.71%; Pfizer Inc (PFE) up 2.32%.
What is driving Novartis AG (NVS)’s stock price up today?
Novartis AG experienced positive upward momentum accompanied by heightened intraday volatility as market participants reacted to the company's strong financial performance and favorable earnings outlook. The primary driver behind the stock's advance stems from core earnings per share topping consensus estimates, underpinned by robust expansion in operating margins. High-growth key commercial therapies, most notably Kisqali, Kesimpta, Scemblix, and Leqvio, delivered resilient volume expansion. This strong product portfolio performance effectively reassured investors of the pharmaceutical giant's ability to offset revenue headwinds caused by generic competition against older legacy blockbusters.
Further strengthening institutional sentiment was management's decision to raise full-year core operating income guidance, revising projections upward from an anticipated decline to positive low-single-digit growth. This upgrade highlighted operational efficiencies and disciplined cost management, particularly a noticeable reduction in selling, general, and administrative expenses. Additionally, management elevated peak sales expectations for promising pipeline assets, such as Rhapsido, while demonstrating capital allocation discipline following recent clinical program write-downs. The combination of upgraded profitability targets and pipeline progress reinforced long-term revenue replacement visibility.
From a market strategy perspective, the upward shift in share price reflects favorable institutional positioning and positive technical momentum indicators. Although non-cash write-downs related to specific R&D assets previously introduced near-term noise into reported results, institutional investors have prioritized the company's core operational strength, cash generation, and structural margin expansion. The heightened trading volatility underscores active portfolio adjustments as market participants re-evaluate valuation multiples in light of Novartis's revised growth profile and sustained margin expansion trajectory.
Technical Analysis of Novartis AG (NVS)
Technically, Novartis AG (NVS) shows a MACD (12,26,9) value of 2.242, indicating a buy signal. The RSI at 70.145 suggests buy condition and the Williams %R at 0.835 suggests overbought condition. Please monitor closely.
Fundamental Analysis of Novartis AG (NVS)
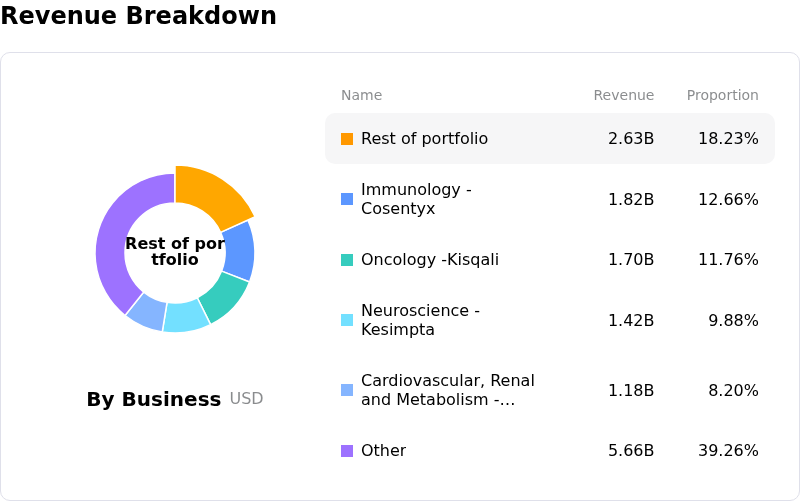
Novartis AG (NVS) is in the Pharmaceuticals & Medical Research industry. Its latest annual revenue is $56.33B, ranking 9 in the industry. The net profit is $13.98B, ranking 5 in the industry. Company Profile
Over the past month, multiple analysts have rated the company as Hold, with an average price target of $153.86, a high of $185.00, and a low of $120.79.
More details about Novartis AG (NVS)
Company Specific Risks:
- Wall Street Downgrade and Stretched Valuation: Deutsche Bank downgraded Novartis to Sell from Hold with a reduced price target of CHF 115, warning that the stock's recent rally has over-extended its valuation relative to its organic growth prospects, leaving shares vulnerable due to a scarcity of positive late-stage clinical catalysts.
- Pipeline Trial Setbacks and Severe Impairment Charges: High-profile Phase 3 clinical trial failures for late-stage candidates pelacarsen and del-desiran resulted in a $1.9 billion impairment charge, driving a 70% year-over-year drop in Q3 reported net income and exposing major clinical execution risks in the pipeline.
- Generic Erosion and Top-Line Revenue Miss: Sales of blockbuster cardiovascular drug Entresto fell by over 50% due to accelerating generic competition, contributing to a third-quarter revenue shortfall ($14.52 billion reported versus $14.60 billion expected) and underscoring the pressure on newer products to replace lost legacy revenue.
- Declining Free Cash Flow and Escalating Debt Burden: Quarterly free cash flow dropped 18% year-over-year to $5.11 billion as working capital movements and interest costs dragged on liquidity, while net debt expanded to $37.4 billion from $21.9 billion at year-end, constraining financial flexibility.
This article may include AI-generated content that is human-reviewed, which is for reference and general information purposes only and does not constitute investment advice.
Recommended Articles








Comments (0)
Click the $ button, enter the symbol, and select to link a stock, ETF, or other ticker.