


Home Depot Inc Stock (HD) Moved Up by 3.32% on Nov 4: What Investors Need To Know


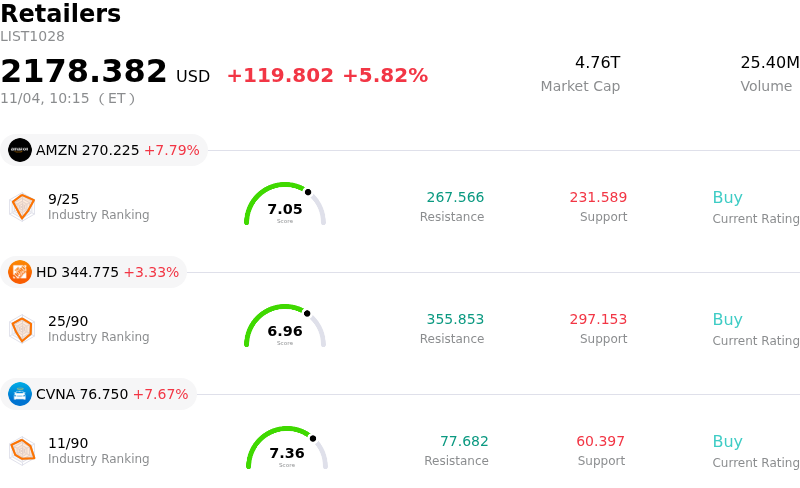
Home Depot Inc (HD) moved up by 3.32%. The Retailers sector is up by 5.82%. The company underperformed the industry. Top 3 stocks by turnover in the sector: Amazon.com Inc (AMZN) up 7.74%; Home Depot Inc (HD) up 3.33%; Carvana Co (CVNA) up 7.60%.
What is driving Home Depot Inc (HD)’s stock price up today?
The positive price action in Home Depot shares reflects a broader market rotation into rate-sensitive consumer discretionary names. Macroeconomic sentiment has received support from shifting expectations around central bank monetary policy and stabilizing Treasury yields. Given Home Depot's direct sensitivity to mortgage rate trends and housing market liquidity, any temporary relief in borrowing costs boosts investor confidence regarding home turnover and renovation spending, prompting capital flows back into leading retail names.
Market participants are also actively positioning ahead of the company's upcoming third-quarter earnings release. Investor optimism is anchored by management's focus on operational execution, cost control, and market share retention despite a subdued housing environment. Early holiday promotional initiatives and Black Friday sales events are providing additional near-term revenue visibility, supporting expectations that consumer traffic across seasonal categories can cushion softer big-ticket discretionary remodeling projects.
Institutional portfolio adjustments have further underpinned trading activity, as major asset managers adjust allocations toward high-quality, dividend-paying market leaders. Home Depot's strategic focus on its professional contractor business continues to serve as a vital stabilizer for sales volume amid broader do-it-yourself consumer caution. Meanwhile, intraday price volatility underscores an ongoing tug-of-war between short-term technical buyers capitalizing on positive momentum and cautious investors weighing fundamental valuation multiples against lingering macroeconomic headwinds.
Technical Analysis of Home Depot Inc (HD)
Technically, Home Depot Inc (HD) shows a MACD (12,26,9) value of 6.879, indicating a buy signal. The RSI at 70.752 suggests buy condition and the Williams %R at 14.874 suggests overbought condition. Please monitor closely.
Fundamental Analysis of Home Depot Inc (HD)
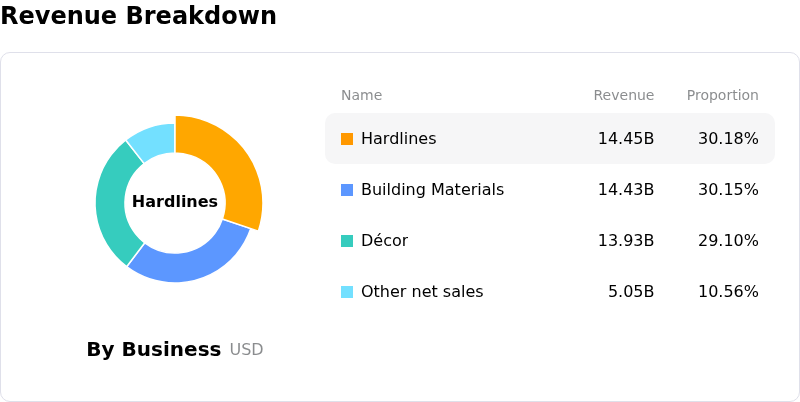
Home Depot Inc (HD) is in the Retailers industry. Its latest annual revenue is $164.68B, ranking 1 in the industry. The net profit is $14.16B, ranking 1 in the industry. Company Profile
Over the past month, multiple analysts have rated the company as Buy, with an average price target of $372.86, a high of $425.00, and a low of $255.00.
More details about Home Depot Inc (HD)
Company Specific Risks:
- Macroeconomic Housing Drag & Deferred Renovation Projects: Persistent high mortgage rates continue to suppress U.S. existing home sales and housing turnover, leading consumers to delay big-ticket discretionary remodeling projects and dampening volume growth across key DIY product categories.
- Gross Margin Contraction & Acquisition Mix Pressure: Strategic expansion into wholesale supply via acquisitions like SRS Distribution increases lower-margin mix pressure, which—alongside ongoing supply chain expenses—leaves management projecting third-quarter gross margins to decline 50 to 60 basis points.
- Execution & Margin Dilution Risks in Pro Segment Shift: The company's aggressive pivot to capture larger professional contractors and commercial builders increases operational complexity and integration risks, raising institutional analyst concerns regarding potential margin dilution and long-term earnings volatility.
- Elevated Valuation Multiples & Sector Rebalancing: Trading at a forward P/E of approximately 22.7x and a PEG ratio of 2.43—a premium relative to historical retail-wholesale industry averages—leaves the stock vulnerable to intraday institutional profit-taking and sector rotation ahead of upcoming Q3 earnings.
This article may include AI-generated content that is human-reviewed, which is for reference and general information purposes only and does not constitute investment advice.
Recommended Articles









Comments (0)
Click the $ button, enter the symbol, and select to link a stock, ETF, or other ticker.