


Nebius Group NV Stock (NBIS) Closed Up by 7.25% on Nov 3: What Investors Need To Know


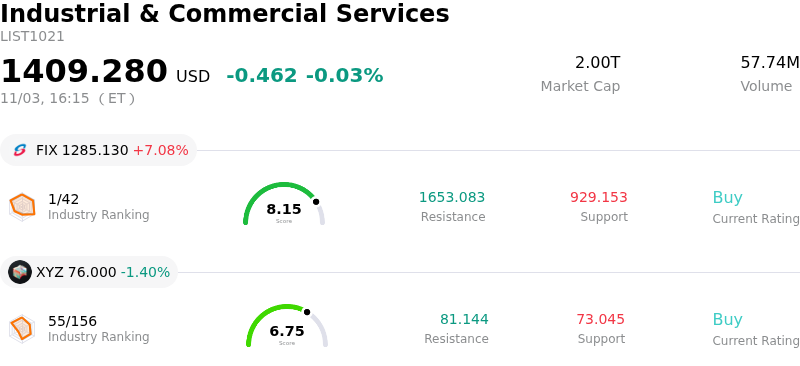
Nebius Group NV (NBIS) closed up by 7.25%. The Industrial & Commercial Services sector is down by 0.03%. The company outperformed the industry. Top 3 stocks by turnover in the sector: Comfort Systems USA Inc (FIX) up 7.08%; Fiserv Ord Shs (FISV) up 12.46%; Block Inc (XYZ) down 1.40%.
What is driving Nebius Group NV (NBIS)’s stock price up today?
Nebius Group experienced a notable upward move driven by a sharp technical rebound and opportunistic dip-buying following a prolonged sell-off in recent weeks. The broader neocloud and artificial intelligence infrastructure sector had previously faced heavy selling pressure due to market anxieties regarding massive capital expenditure requirements, rising debt financing costs, and capex guidance adjustments from major hyperscalers. As the stock approached oversold technical territory, institutional and retail buyers stepped in to absorb recent supply, triggering a powerful relief rally.
Macroeconomic conditions and sector-wide sentiment provided additional tailwinds for high-beta technology equities. A broader recovery across benchmark equity indexes, led by notable strength in semiconductor and cloud computing names, helped stabilize market-wide risk appetite. Market participants increasingly viewed the recent pullback across specialized compute providers as an overreaction, recognizing that underlying enterprise demand for high-density graphics processing unit clusters and managed AI cloud services remains resilient.
Positioning ahead of the company's upcoming quarterly financial results also contributed to today's positive price momentum. Investors are anticipating significant top-line revenue expansion driven by the continued deployment of GPU capacity and the execution of major multi-year enterprise infrastructure contracts. Despite ongoing market scrutiny surrounding balance sheet leverage and capital intensity, Wall Street analyst consensus remains largely constructive, with overall price targets reflecting substantial upside potential relative to recent trading levels.
Technical Analysis of Nebius Group NV (NBIS)
Technically, Nebius Group NV (NBIS) shows a MACD (12,26,9) value of -3.656, indicating a sell signal. The RSI at 37.310 suggests neutral condition and the Williams %R at 77.345 suggests sell condition. Please monitor closely.
Fundamental Analysis of Nebius Group NV (NBIS)
Nebius Group NV (NBIS) is in the Industrial & Commercial Services industry. Its latest annual revenue is $529.80M, ranking 113 in the industry. The net profit is $82.50M, ranking 74 in the industry. Company Profile
Over the past month, multiple analysts have rated the company as Buy, with an average price target of $289.34, a high of $410.00, and a low of $144.00.
More details about Nebius Group NV (NBIS)
Company Specific Risks:
- Short-Term Debt Refinancing Vulnerability: Nebius faces severe liquidity risk tied to a $3.5 billion short-term credit facility maturing in 364 days at steep interest rates of SOFR plus 2.75% to 3.50%, creating acute refinancing hurdles as projected 2026 capital expenditures of $20 billion to $25 billion far exceed operating cash generation.
- Neocloud Sector Contagion and Spending Weakness: Intraday volatility has been heightened by broader neocloud sector weakness following analyst warnings that over 80% of independent AI infrastructure providers will face structural consolidation by 2030, compounded by hyperscaler capex misses that threaten GPU compute rental pricing power.
- Heightened Shareholder Dilution Risk: To fund massive data center buildouts, Nebius has engaged in heavy capital dilution, including the sale of 12.7 million shares through an at-the-market equity program alongside carrying $8.5 billion in convertible debt at book value.
- High Customer Concentration and Insider Selling: Revenue remains structurally vulnerable to customer churn with three top clients accounting for 59% of second-quarter revenue, while market sentiment is further undermined by insider stock sales and institutional stake reductions by key funds.
This article may include AI-generated content that is human-reviewed, which is for reference and general information purposes only and does not constitute investment advice.
Recommended Articles







Comments (0)
Click the $ button, enter the symbol, and select to link a stock, ETF, or other ticker.