


T-Mobile US Inc Stock (TMUS) Moved Down by 3.52% on Nov 3: Drivers Behind the Movement


T-Mobile US Inc (TMUS) moved down by 3.52%. The Telecommunications Services sector is up by 1.87%. The company underperformed the industry. Top 3 stocks by turnover in the sector: SpaceX (SPCX) up 3.31%; AT&T Inc (T) down 0.91%; Verizon Communications Inc (VZ) down 0.12%.
What is driving T-Mobile US Inc (TMUS)’s stock price down today?
T-Mobile US experienced downward pressure as investors engaged in profit-taking following a sharp post-earnings rally. While the company recently reported third-quarter results that surpassed Wall Street expectations for revenue and adjusted earnings alongside a raised full-year cash flow outlook, market sentiment shifted toward near-term operational challenges. Investors are reassessing the sustainability of growth given an uptick in postpaid account churn and higher operational costs associated with promotional device subsidies.
The broader telecommunications landscape continues to face heightened promotional intensity as carriers navigate device upgrade cycles. Elevated device pricing from manufacturers and aggressive customer retention incentives have weighed on operating cost projections across the sector. Additionally, lingering market attention on long-term competitive developments in direct-to-cell technologies and potential future spectrum auction outlays prompted institutional investors to recalibrate their exposure after recent gains.
Beyond company-specific dynamics, broader market volatility and sector rotation within communication services contributed to the downward movement. Despite T-Mobile maintaining robust 5G broadband expansion and steady account growth, near-term caution regarding subscriber acquisition expenses and heightened industry competition continues to dictate short-term price adjustments.
Technical Analysis of T-Mobile US Inc (TMUS)
Technically, T-Mobile US Inc (TMUS) shows a MACD (12,26,9) value of 2.060, indicating a neutral signal. The RSI at 46.831 suggests neutral condition and the Williams %R at 43.847 suggests buy condition. Please monitor closely.
Media Coverage of T-Mobile US Inc (TMUS)
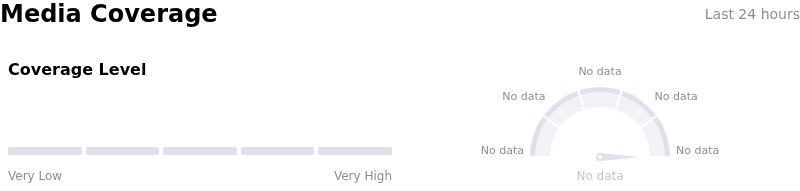
In terms of media coverage, T-Mobile US Inc (TMUS) shows a coverage score of 49, indicating a moderate level of media attention. The overall market sentiment index is currently in extremely bearish zone.
Fundamental Analysis of T-Mobile US Inc (TMUS)
T-Mobile US Inc (TMUS) is in the Telecommunications Services industry. Its latest annual revenue is $88.31B, ranking 4 in the industry. The net profit is $10.99B, ranking 4 in the industry. Company Profile
Over the past month, multiple analysts have rated the company as Buy, with an average price target of $224.42, a high of $310.00, and a low of $165.00.
More details about T-Mobile US Inc (TMUS)
Company Specific Risks:
- Emerging Satellite Network Disruption: Industry reports detailing SpaceX's acquisition of 800 MHz spectrum and potential acquisition of Boost Mobile to build a hybrid satellite-terrestrial network have intensified analyst concerns regarding direct-to-cell competition bypassing traditional carrier infrastructure.
- Postpaid Account Slowdown and Rising Churn: Third-quarter financial disclosures revealed a deceleration in postpaid net account additions down to 274,000 from 396,000 year-over-year, alongside a churn increase to 1.09% triggered by price increases on legacy plans and aggressive customer retention efforts by AT&T and Verizon.
- Equipment and Operating Cost Inflation: Equipment sales expenses climbed 12.2% year-over-year to $5.44 billion due to higher smartphone manufacturer pricing, while service costs increased 4.7%, threatening to compress operating margins if promotional expenses remain elevated.
- Elevated Debt Load and Capex Rebound: T-Mobile carries over $77.3 billion in long-term debt, and recent free cash flow expansion is expected to face headwinds as cash capital expenditures increase in upcoming quarters to support fiber joint ventures and network integration obligations.
This article may include AI-generated content that is human-reviewed, which is for reference and general information purposes only and does not constitute investment advice.
Recommended Articles







Comments (0)
Click the $ button, enter the symbol, and select to link a stock, ETF, or other ticker.