


Vertex Pharmaceuticals Inc Stock (VRTX) Moved Down by 3.61% on Nov 3: Drivers Behind the Movement


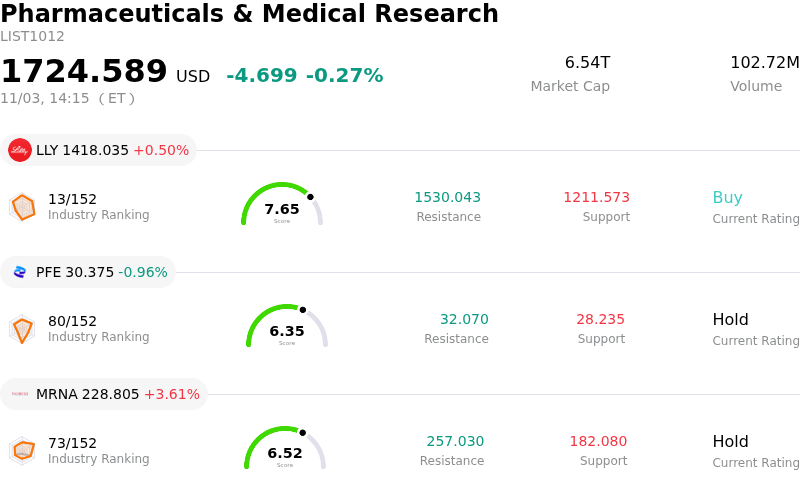
Vertex Pharmaceuticals Inc (VRTX) moved down by 3.61%. The Pharmaceuticals & Medical Research sector is down by 0.27%. The company underperformed the industry. Top 3 stocks by turnover in the sector: Eli Lilly and Co (LLY) up 0.50%; Pfizer Inc (PFE) down 0.96%; Moderna Inc (MRNA) up 3.61%.
What is driving Vertex Pharmaceuticals Inc (VRTX)’s stock price down today?
Vertex Pharmaceuticals experienced a pullback following the release of its third-quarter financial results. Although top-line revenue expanded year-over-year and surpassed consensus estimates, adjusted earnings per share missed Wall Street expectations. Profitability faced notable pressure from a sharp surge in operating expenses, driven by accelerated investments in research and development alongside selling, general, and administrative costs. Additionally, integration expenses related to the recently closed acquisition of Crinetics Pharmaceuticals and reduced net interest income weighed on net margins, triggering profit-taking following the stock's recent climb near its 52-week high.
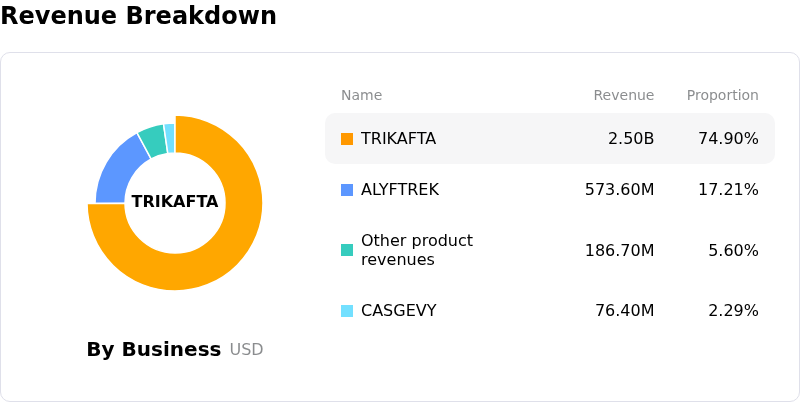
Underlying commercial performance displayed a mix of solid core adoption and launch-related margin drag. Vertex's core cystic fibrosis portfolio maintained high-margin stability, supported by the rapid uptake of its next-generation therapy Alyftrek, even as legacy product Trikafta saw lower sales due to patient conversion. However, outside of cystic fibrosis, non-opioid pain medication Journavx generated revenue below consensus expectations. Management's decision to extend patient support programs into 2027 to build prescribing habits and drive market share resulted in higher initial discounting, temporarily compressing gross-to-net realization.
Although management raised full-year revenue guidance, market sentiment was tempered by analyst observations that the revision primarily incorporated the post-close inclusion of Crinetics rather than an organic acceleration in the base business. Nevertheless, institutional sentiment remains structurally constructive. Wall Street analysts highlighted Vertex's expanding commercial pillars in rare endocrinology, gene-editing therapies, and upcoming regulatory action dates in nephrology as vital catalysts capable of diversifying long-term cash flow streams once near-term expense digestion settles.
Technical Analysis of Vertex Pharmaceuticals Inc (VRTX)
Technically, Vertex Pharmaceuticals Inc (VRTX) shows a MACD (12,26,9) value of 7.743, indicating a buy signal. The RSI at 54.125 suggests neutral condition and the Williams %R at 49.890 suggests neutral condition. Please monitor closely.
Media Coverage of Vertex Pharmaceuticals Inc (VRTX)
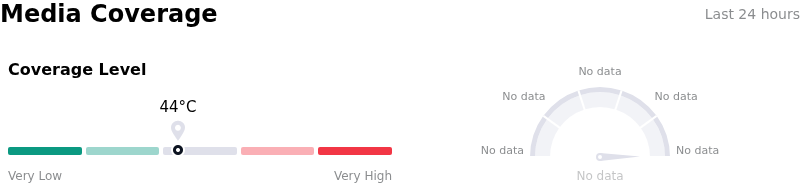
In terms of media coverage, Vertex Pharmaceuticals Inc (VRTX) shows a coverage score of 44, indicating a moderate level of media attention. The overall market sentiment index is currently in extremely bullish zone.
Fundamental Analysis of Vertex Pharmaceuticals Inc (VRTX)
Vertex Pharmaceuticals Inc (VRTX) is in the Pharmaceuticals & Medical Research industry. Its latest annual revenue is $12.00B, ranking 21 in the industry. The net profit is $3.95B, ranking 16 in the industry. Company Profile
Over the past month, multiple analysts have rated the company as Buy, with an average price target of $572.01, a high of $667.00, and a low of $350.00.
More details about Vertex Pharmaceuticals Inc (VRTX)
Company Specific Risks:
- Q3 Earnings Miss and Operating Margin Compression: In its Q3 2026 financial results, Vertex reported adjusted EPS of $4.76, missing analyst consensus estimates, while GAAP EPS dropped significantly to $2.56 from $4.20 in the year-ago period. The company's operating margin contracted from 38.6% to 20.7% due to a 44% surge in operating expenses and acquisition-related costs for Crinetics Pharmaceuticals.
- Flagship Product Revenue Softness and Franchise Concentration: Sales of Trikafta/Kaftrio, the primary driver of Vertex's core cystic fibrosis (CF) franchise, fell approximately 8% year-over-year to $2.4 billion. Because CF therapies still account for over 80% of total company revenues, weakness in its flagship asset highlights top-line vulnerability during the ongoing patient transition to Alyftrek.
- Full-Year Revenue Guidance Trailing Consensus Projections: Vertex updated its full-year 2026 revenue guidance to a range of $13.15 billion to $13.25 billion ($13.20 billion midpoint). Despite representing a slight internal raise, the midpoint trailed Wall Street consensus expectations of $13.28 billion, sparking concerns regarding top-line growth momentum.
- Elevated Expenses and Valuation Sensitivity Around Pipeline Milestones: Cash reserves declined to $9.8 billion from $12.3 billion following heavy outlays for acquisitions and share repurchases, while combined full-year GAAP expense guidance was pushed up to $7.15–$7.20 billion. With shares trading near 52-week highs at a P/E multiple above 31x, high cash burn leaves minimal margin of safety if upcoming regulatory milestones—such as the November 30 IgAN PDUFA target date for povetacicept—encounter unexpected hurdles.
This article may include AI-generated content that is human-reviewed, which is for reference and general information purposes only and does not constitute investment advice.
Recommended Articles








Comments (0)
Click the $ button, enter the symbol, and select to link a stock, ETF, or other ticker.