


Interactive Brokers Group Inc Stock (IBKR) Moved Up by 3.04% on Nov 3: What Investors Need To Know


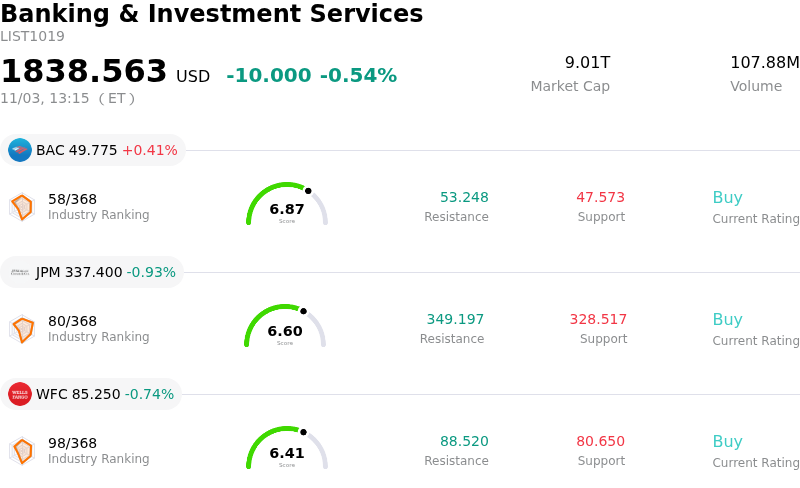
Interactive Brokers Group Inc (IBKR) moved up by 3.04%. The Banking & Investment Services sector is down by 0.54%. The company outperformed the industry. Top 3 stocks by turnover in the sector: Bank of America Corp (BAC) up 0.41%; JPMorgan Chase & Co (JPM) down 0.93%; Wells Fargo & Co (WFC) down 0.74%.
What is driving Interactive Brokers Group Inc (IBKR)’s stock price up today?
Interactive Brokers Group experienced renewed buying pressure following the release of its electronic brokerage performance metrics for October 2026. The company disclosed a 5% month-over-month increase in Daily Average Revenue Trades to 4.306 million, driven by heightened trading activity across global markets. Total client accounts expanded 34% year-over-year to 5.678 million, demonstrating robust customer acquisition across retail and institutional segments. Furthermore, client margin loan balances increased 31% year-over-year to $106.8 billion. This growth in borrowing activity reassures investors that net interest income—a key earnings driver for the firm—remains resilient despite broader market fluctuations.
The positive sentiment is further bolstered by the strong fundamental backdrop established in the company's third-quarter financial results. Interactive Brokers posted net revenues of $1.91 billion, up 16% year-over-year, supported by steady commission revenue and record pre-tax income that maintained industry-leading margins above 70%. Management's recent decision to raise the quarterly dividend by 71% provided a strong signal of capital health and cash flow visibility. In addition, investor enthusiasm has been reinforced by technological platform rollouts, such as expanded artificial intelligence capabilities that allow automated trade monitoring and execution, strengthening the broker's competitive position among high-volume traders.
From an industry standpoint, steady global market activity and active trading across options, equities, and futures continue to generate favorable operating tailwinds. With an efficient, automated low-cost model, high operating efficiency, and steady client account growth, Interactive Brokers remains well-positioned to benefit from ongoing retail and institutional trading participation.
Technical Analysis of Interactive Brokers Group Inc (IBKR)
Technically, Interactive Brokers Group Inc (IBKR) shows a MACD (12,26,9) value of -1.177, indicating a sell signal. The RSI at 37.320 suggests neutral condition and the Williams %R at 80.422 suggests oversold condition. Please monitor closely.
Media Coverage of Interactive Brokers Group Inc (IBKR)
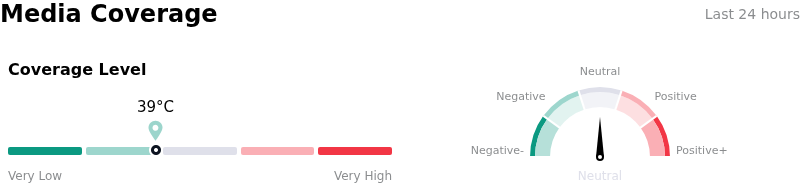
In terms of media coverage, Interactive Brokers Group Inc (IBKR) shows a coverage score of 39, indicating a low level of media attention. The overall market sentiment index is currently in neutral zone.
Fundamental Analysis of Interactive Brokers Group Inc (IBKR)
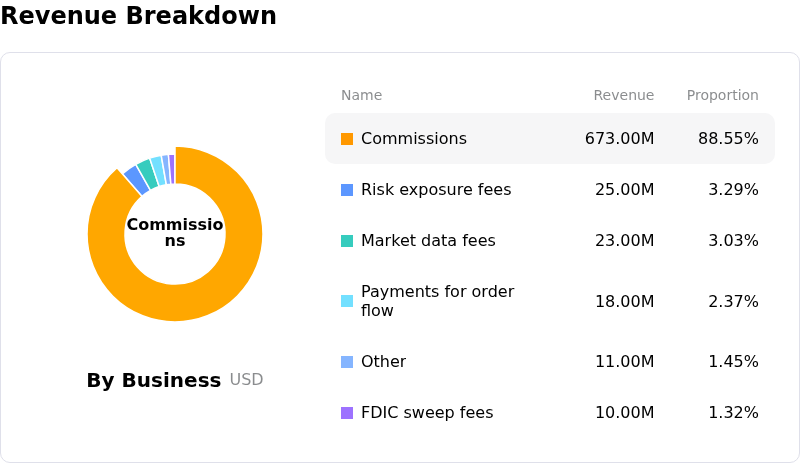
Interactive Brokers Group Inc (IBKR) is in the Banking & Investment Services industry. Its latest annual revenue is $10.00B, ranking 24 in the industry. The net profit is $984.00M, ranking 24 in the industry. Company Profile
Over the past month, multiple analysts have rated the company as Buy, with an average price target of $104.39, a high of $120.00, and a low of $73.19.
More details about Interactive Brokers Group Inc (IBKR)
Company Specific Risks:
- Declining Trading Volumes and DART Moderation: Recent monthly disclosures and quarterly operational metrics revealed a sequential moderation in Daily Average Revenue Trades (DARTs) alongside a 24% drop in stock share volume, reducing average commission revenue per cleared order to $2.59 as active retail and institutional trading momentum cools.
- Net Interest Margin Compression from Rate Cuts: Benchmark interest rate reductions present a structural headwind to net interest income, directly eroding yields earned on billions in idle client cash balances and margin loan portfolios.
- Regulatory and Clearing Expense Inflation: Quarterly execution, clearing, and distribution expenses surged 46% year-over-year to $134 million, driven significantly by $30 million in SEC regulatory fees, creating operational margin pressure despite top-line expansion.
- Valuation Vulnerability to Brokerage Sector Sell-Offs: Elevated valuation multiples leave the stock exposed to sharp intraday swings, as evidenced by single-session drawdowns of nearly 6% during broader market risk-off rotations and earnings disappointments across peer online brokerages.
This article may include AI-generated content that is human-reviewed, which is for reference and general information purposes only and does not constitute investment advice.
Recommended Articles








Comments (0)
Click the $ button, enter the symbol, and select to link a stock, ETF, or other ticker.