


USD/CHF Price Forecast: Bullish engulfing puts 0.8400 in play



- USD/CHF confirms bullish engulfing pattern, preserving higher highs and lows.
- Bullish RSI strengthens upside momentum as buyers approach 0.8300 resistance.
- Break above 0.8300 exposes 0.8354, followed by 0.8395 and 0.8400.
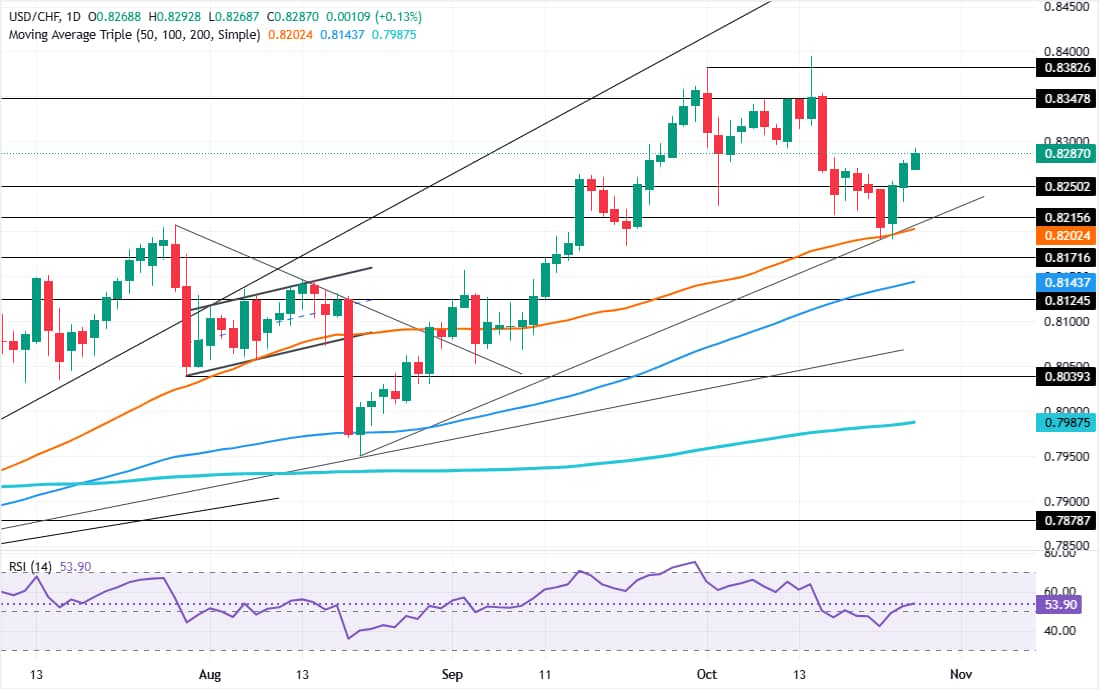
The USD/CHF advances for the third straight day, registering modest gains of 0.09% on Tuesday, with the pair recovering some ground after hitting a monthly low of 0.8191 last Friday. The pair exchanges hands at 0.8282 with buyers eyeing the 0.8300 mark.
USD/CHF Price Forecast: Technical outlook
Price action shows that the trend is up as the market structure of higher highs and higher lows is respected. Also, the formation of a ‘bullish engulfing’ candle pattern last week was confirmed on Monday, with the USD/CHF clearing the October 23 high of 0.8256, which exacerbated the continuation of the trend.
Momentum turned bullish as depicted in the Relative Strength Index (RSI). Therefore, as price action and the RSI confirm, the USD/CHF path of least resistance is upward.
The first area of interest would be the 0.8300 mark. A breach of the latter will expose the October 15 high of 0.8354, with the next stop seen at 0.8395, the October 14 swing high. Once cleared, 0.8400 is up next, followed by the May 12, 2025 high of 0.8476.
For a bearish reversal, the first support for USD/CHF is Monday’s low of 0.8232. Below is the 50-day Simple Moving Average (SMA) of 0.8202, followed by the 0.8200 figure. A move past that area clears the way towards the 100-day SMA at 0.8143.
USD/CHF Price Chart – Daily
Swiss Franc Price Today
The table below shows the percentage change of Swiss Franc (CHF) against listed major currencies today. Swiss Franc was the strongest against the Euro.
| USD | EUR | GBP | JPY | CAD | AUD | NZD | CHF | |
|---|---|---|---|---|---|---|---|---|
| USD | 0.37% | 0.24% | 0.28% | 0.28% | -0.16% | -0.04% | 0.13% | |
| EUR | -0.37% | -0.12% | -0.07% | -0.09% | -0.52% | -0.41% | -0.22% | |
| GBP | -0.24% | 0.12% | 0.04% | 0.02% | -0.41% | -0.28% | -0.10% | |
| JPY | -0.28% | 0.07% | -0.04% | -0.01% | -0.45% | -0.32% | -0.16% | |
| CAD | -0.28% | 0.09% | -0.02% | 0.00% | -0.43% | -0.31% | -0.14% | |
| AUD | 0.16% | 0.52% | 0.41% | 0.45% | 0.43% | 0.13% | 0.30% | |
| NZD | 0.04% | 0.41% | 0.28% | 0.32% | 0.31% | -0.13% | 0.17% | |
| CHF | -0.13% | 0.22% | 0.10% | 0.16% | 0.14% | -0.30% | -0.17% |
The heat map shows percentage changes of major currencies against each other. The base currency is picked from the left column, while the quote currency is picked from the top row. For example, if you pick the Swiss Franc from the left column and move along the horizontal line to the US Dollar, the percentage change displayed in the box will represent CHF (base)/USD (quote).
Recommended Articles









Comments (0)
Click the $ button, enter the symbol, and select to link a stock, ETF, or other ticker.