


EUR/JPY Price Forecast: Spinning tops warn bulls near 180.00



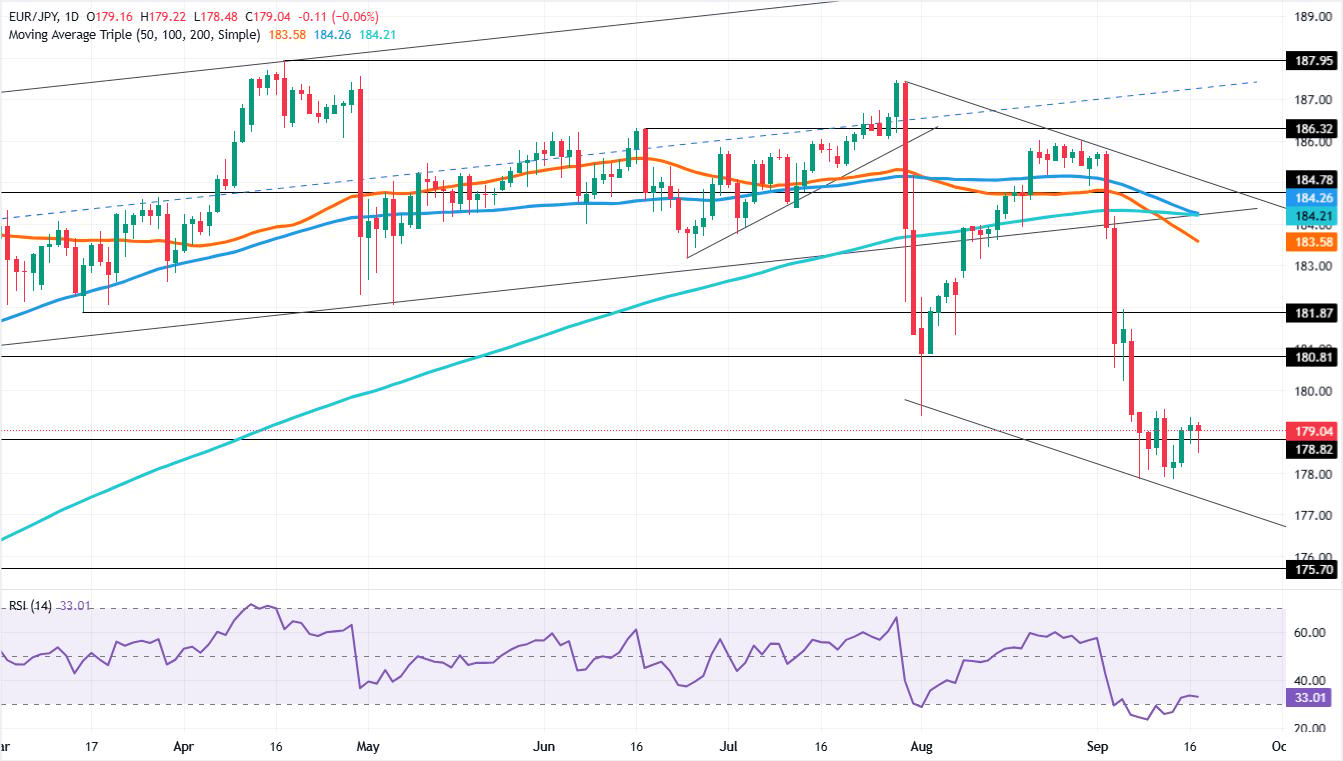
- EUR/JPY forms back-to-back spinning tops near 180.00 resistance.
- RSI turns lower as sellers regain short-term momentum.
- Break below 178.71 exposes 177.85 and 175.70 next.
The EUR/JPY drops by about 0.08% on Thursday, forming back-to-back spinning tops near the 180.00 area, the top of a consolidation range capped to the downside by 178.00. At the time of writing, the cross-pair trades at 179.02, below its opening price.
EUR/JPY Price Forecast: Technical Outlook
The formation of two spinning tops indicates that buyers faced a zone of exhaustion, suggesting the cross might struggle to register a leg-up. Momentum as measured by the Relative Strength Index (RSI) shows that sellers are stepping in, as the index is set to turn to oversold thrice in September.
For a bearish continuation, the EUR/JPY needs to clear the September 16 low of 178.71. Beneath this area is the September 14 low of 177.85, then the November 5, 2025, low of 175.70, followed by 175.00.
On the other hand, for a bullish resumption, EUR/JPY needs to climb above 180.00 before challenging the next key resistance level, the 50-day Simple Moving Average (SMA) at 183.58.
EUR/JPY Price Chart – Daily
Japanese Yen Price This week
The table below shows the percentage change of Japanese Yen (JPY) against listed major currencies this week. Japanese Yen was the strongest against the New Zealand Dollar.
| USD | EUR | GBP | JPY | CAD | AUD | NZD | CHF | |
|---|---|---|---|---|---|---|---|---|
| USD | 1.06% | 1.27% | 1.56% | 0.90% | 0.74% | 1.47% | 1.03% | |
| EUR | -1.06% | 0.19% | 0.47% | -0.16% | -0.31% | 0.42% | -0.06% | |
| GBP | -1.27% | -0.19% | 0.29% | -0.35% | -0.50% | 0.23% | -0.27% | |
| JPY | -1.56% | -0.47% | -0.29% | -0.66% | -0.84% | -0.11% | -0.58% | |
| CAD | -0.90% | 0.16% | 0.35% | 0.66% | -0.13% | 0.62% | 0.07% | |
| AUD | -0.74% | 0.31% | 0.50% | 0.84% | 0.13% | 0.73% | 0.27% | |
| NZD | -1.47% | -0.42% | -0.23% | 0.11% | -0.62% | -0.73% | -0.50% | |
| CHF | -1.03% | 0.06% | 0.27% | 0.58% | -0.07% | -0.27% | 0.50% |
The heat map shows percentage changes of major currencies against each other. The base currency is picked from the left column, while the quote currency is picked from the top row. For example, if you pick the Japanese Yen from the left column and move along the horizontal line to the US Dollar, the percentage change displayed in the box will represent JPY (base)/USD (quote).
Recommended Articles











Comments (0)
Click the $ button, enter the symbol, and select to link a stock, ETF, or other ticker.