


Silver Price Forecasts: XAG/USD remains bullish with dips capped above $67.40



- XAG/USD’s pullback from the $70.00 area has been contained above $67.40.
- US PCE inflation figures maintained pressure on the Fed to hike interest rates and provided some support to the USD.
- Silver bulls remain focused on the key 200-day SMA, around 72.40.
Silver’s (XAG/USD) pullback from the $70.00 area found buyers above $67.40 on Thursday to trim losses and return to the mid-range of the $68.00s during the European morning session. The broader trend remains bullish, with price action steady above previous highs around $67.00, although the cautious market, ahead of the key Jackson Hole Symposium, keeps precious metals trading within range this week.
The US Dollar received some support on Wednesday, as US Personal Consumption Expenditures (PCE) Price Index figures confirmed that inflation remains sticky, well above the US Federal Reserve's (Fed) 2% target. Bets for a September rate hike, however, remained practically unchanged, at 36%, according to the CME Group’s FedWatch Tool.
Market volatility remains subdued with Investors looking from the sidelines, awaiting Fed Chairman Kevin Warsh’s speech at the Jackson Hole summit, due on Friday. Traders are eager for further insight on the bank’s near-term policy, and his comments are likely to determine the near-term direction for US Dollar crosses and precious metals.
Technical Analysis: Bulls keep looking at the 200-day SMA
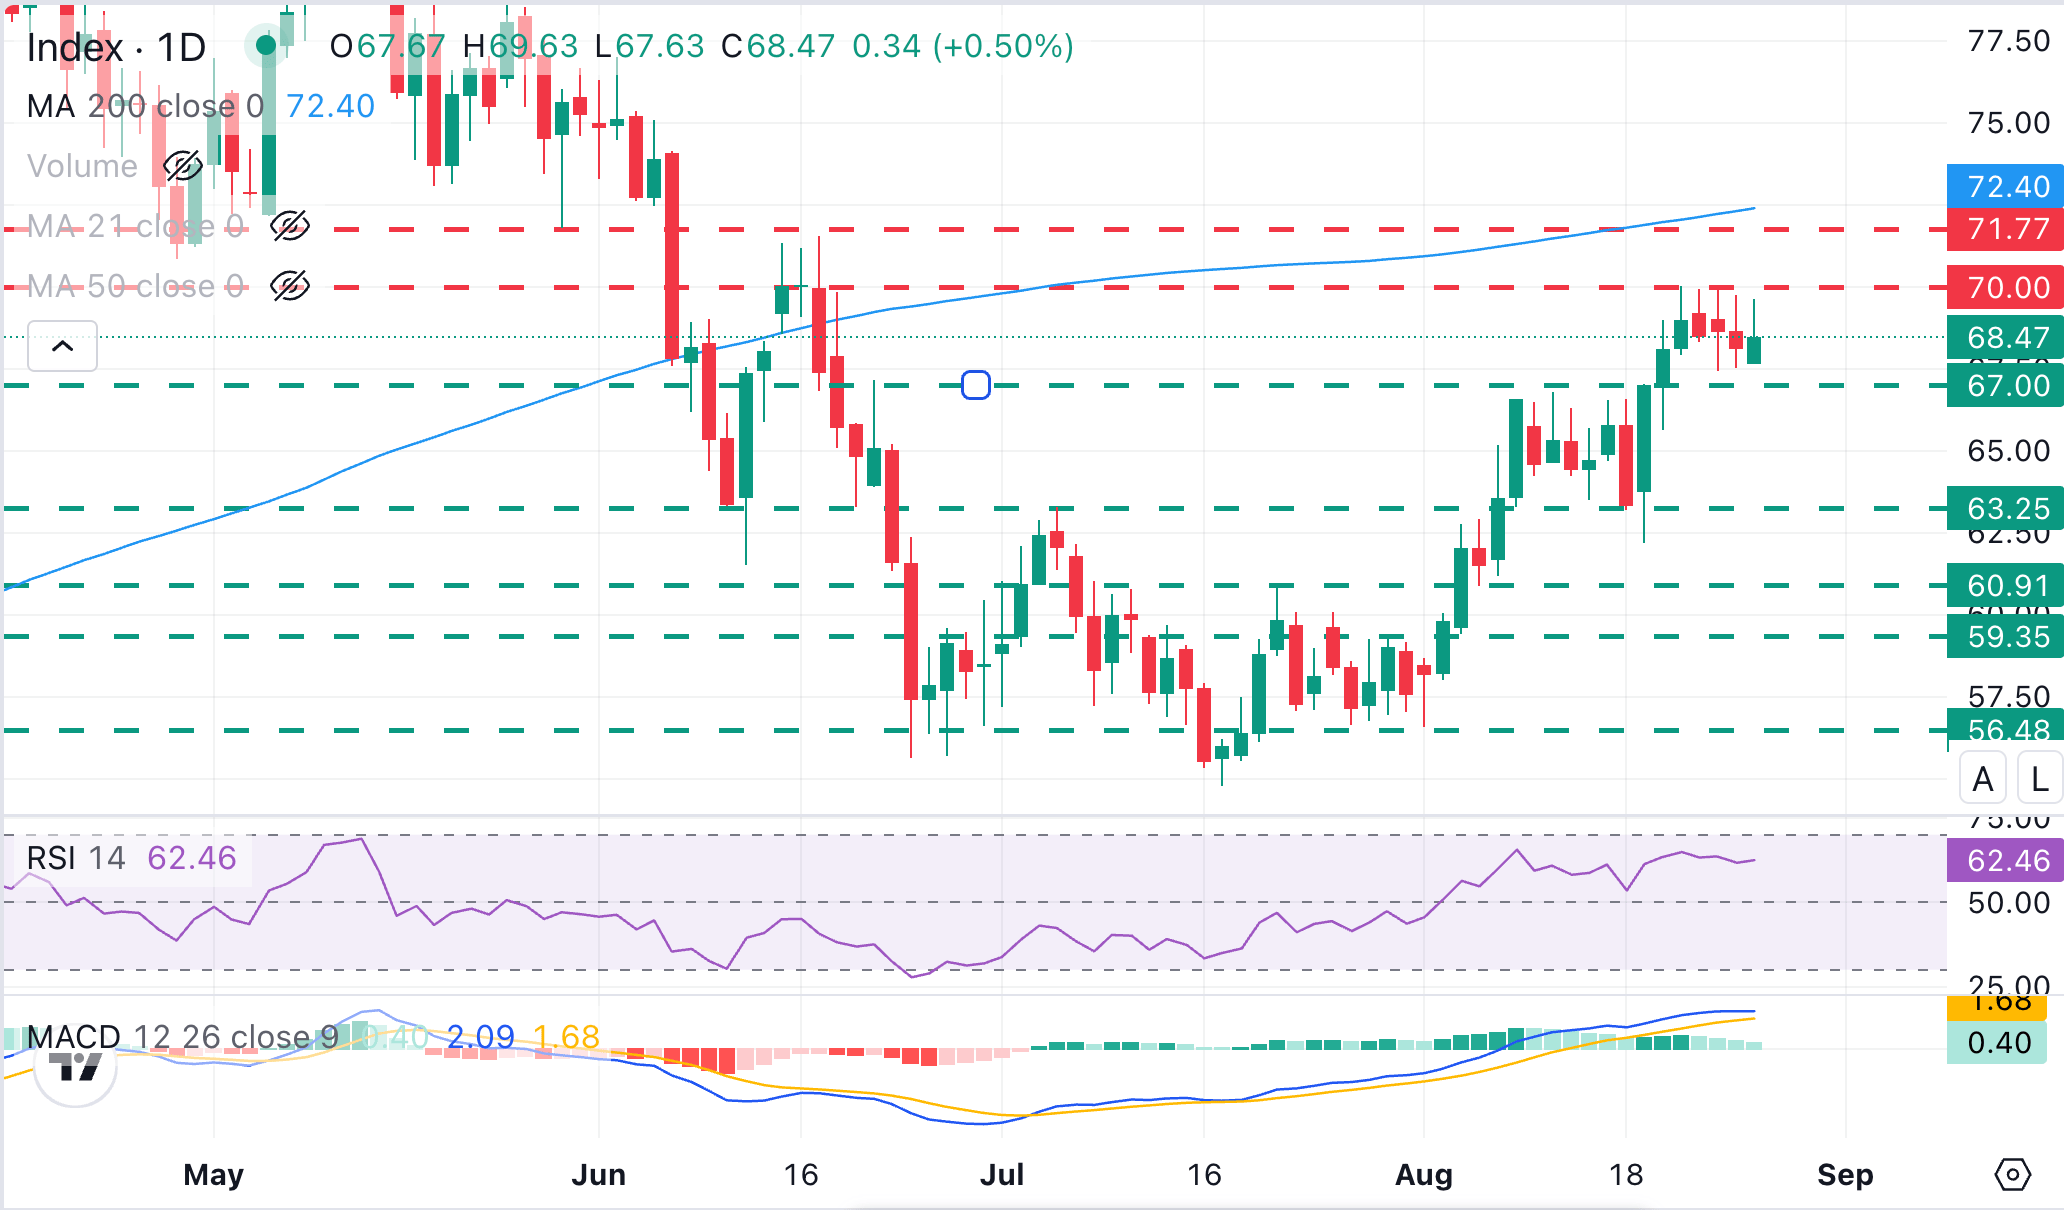
XAG/USD maintains the bullish trend from mid July lows below 55.00, with bulls struggling to break resistance at the $70.00 psychological level, focused in the area between the mid-June highs, at $71.55, and the 200-day Simple Moving Average (SMA), a closely watched indicator in FX markets, that is now fluctuating around 72.40
Momentum indicators in daily charts remain bullish, yet highlight a somewhat weaker impulse. The Relative Strength Index (14) near 63 suggests firm but not extreme bullish momentum, while the Moving Average Convergence Divergence (MACD) indicator moderates with a still-positive reading.
On the downside, initial support is seen at the previous resistance area around $67.00 $67.00, followed by a secondary floor at $63.25, which capped bears on August 18, ahead of the August 6 low, near $60.90.
(The technical analysis of this story was written with the help of an AI tool. Know more.)
Recommended Articles








Comments (0)
Click the $ button, enter the symbol, and select to link a stock, ETF, or other ticker.