


Aave Price Forecast: Consolidates below $161 as profit-taking emerges after 10% surge



- Aave corrects slightly, trading below $161 on Wednesday after surging more than 10% the previous day.
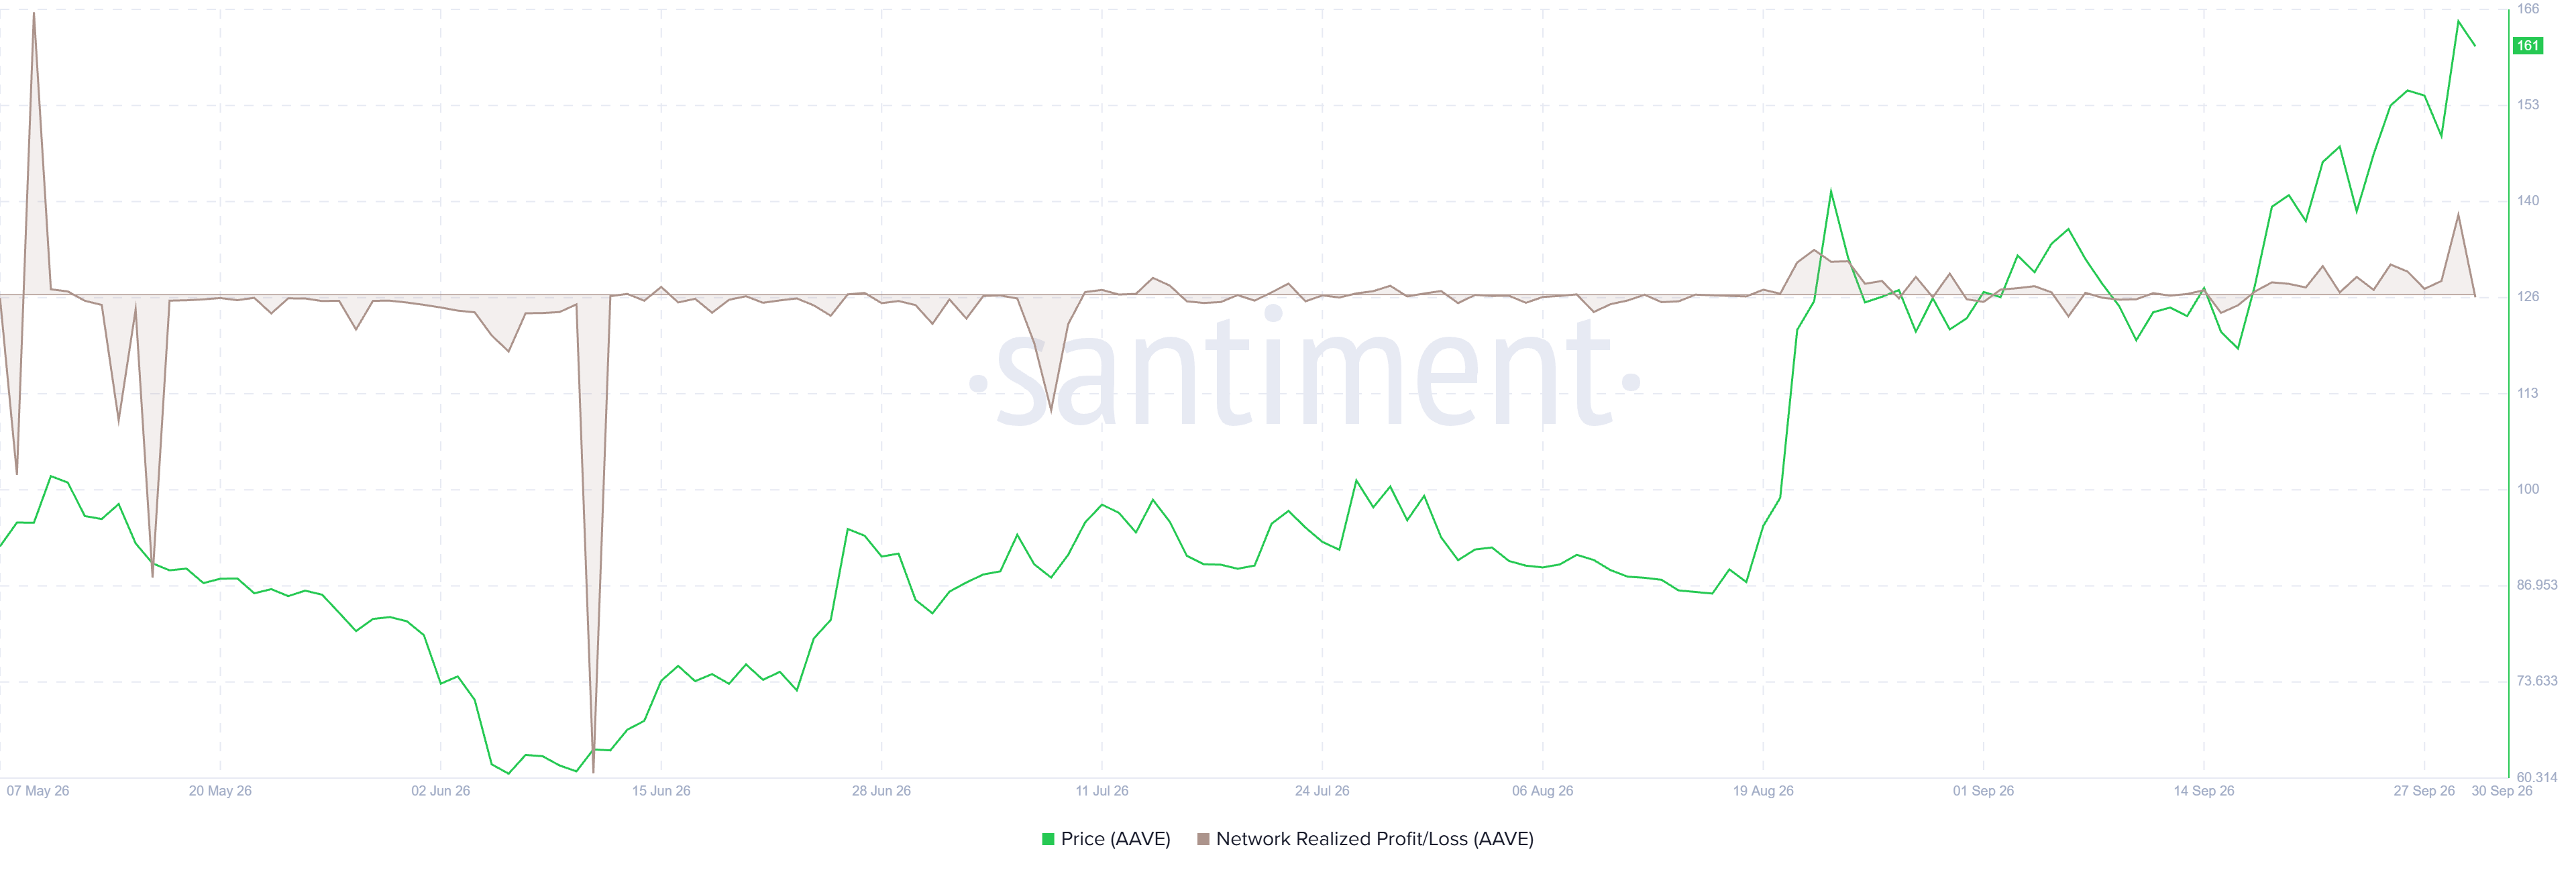
- Santiment data shows AAVE’s NPL metric spiked on Tuesday, signaling increased profit-taking after the sharp price rally.
- Stani Kulechov, Aave founder, is considering adding an AAVE token burn mechanism to Aavenomics 3.0.
Aave (AAVE) slips below $161 on Wednesday after surging more than 10% the previous day, with on-chain data suggesting increased profit-taking. Meanwhile, Aave founder Stani Kulechov is considering an AAVE token-burn mechanism under Aavenomics 3.0, adding a potential catalyst for AAVE.
Profit-taking weighs on AAVE
Santiment’s Network Realized Profit/Loss (NPL) metric indicates Aave holders are booking profits following its recent price surge.
As shown in the chart below, the metric spiked sharply on Tuesday, reaching its highest level since early May. This spike indicates that holders are, on average, selling their bags at a significant profit, thereby increasing the selling pressure.
Aave founder considers AAVE token burn for Aavenomics 3.0
Despite sharp profit-taking, the market sentiment remains bullish for AAVE. Aave founder Stani Kulechov said on Monday that he is considering adding an AAVE token-burn mechanism to Aavenomics 3.0, building on the protocol’s existing revenue-funded buyback program launched in 2025. This proposal could further strengthen AAVE’s tokenomics by reducing the circulating supply alongside the existing buyback mechanism, supporting the bullish long-term outlook.
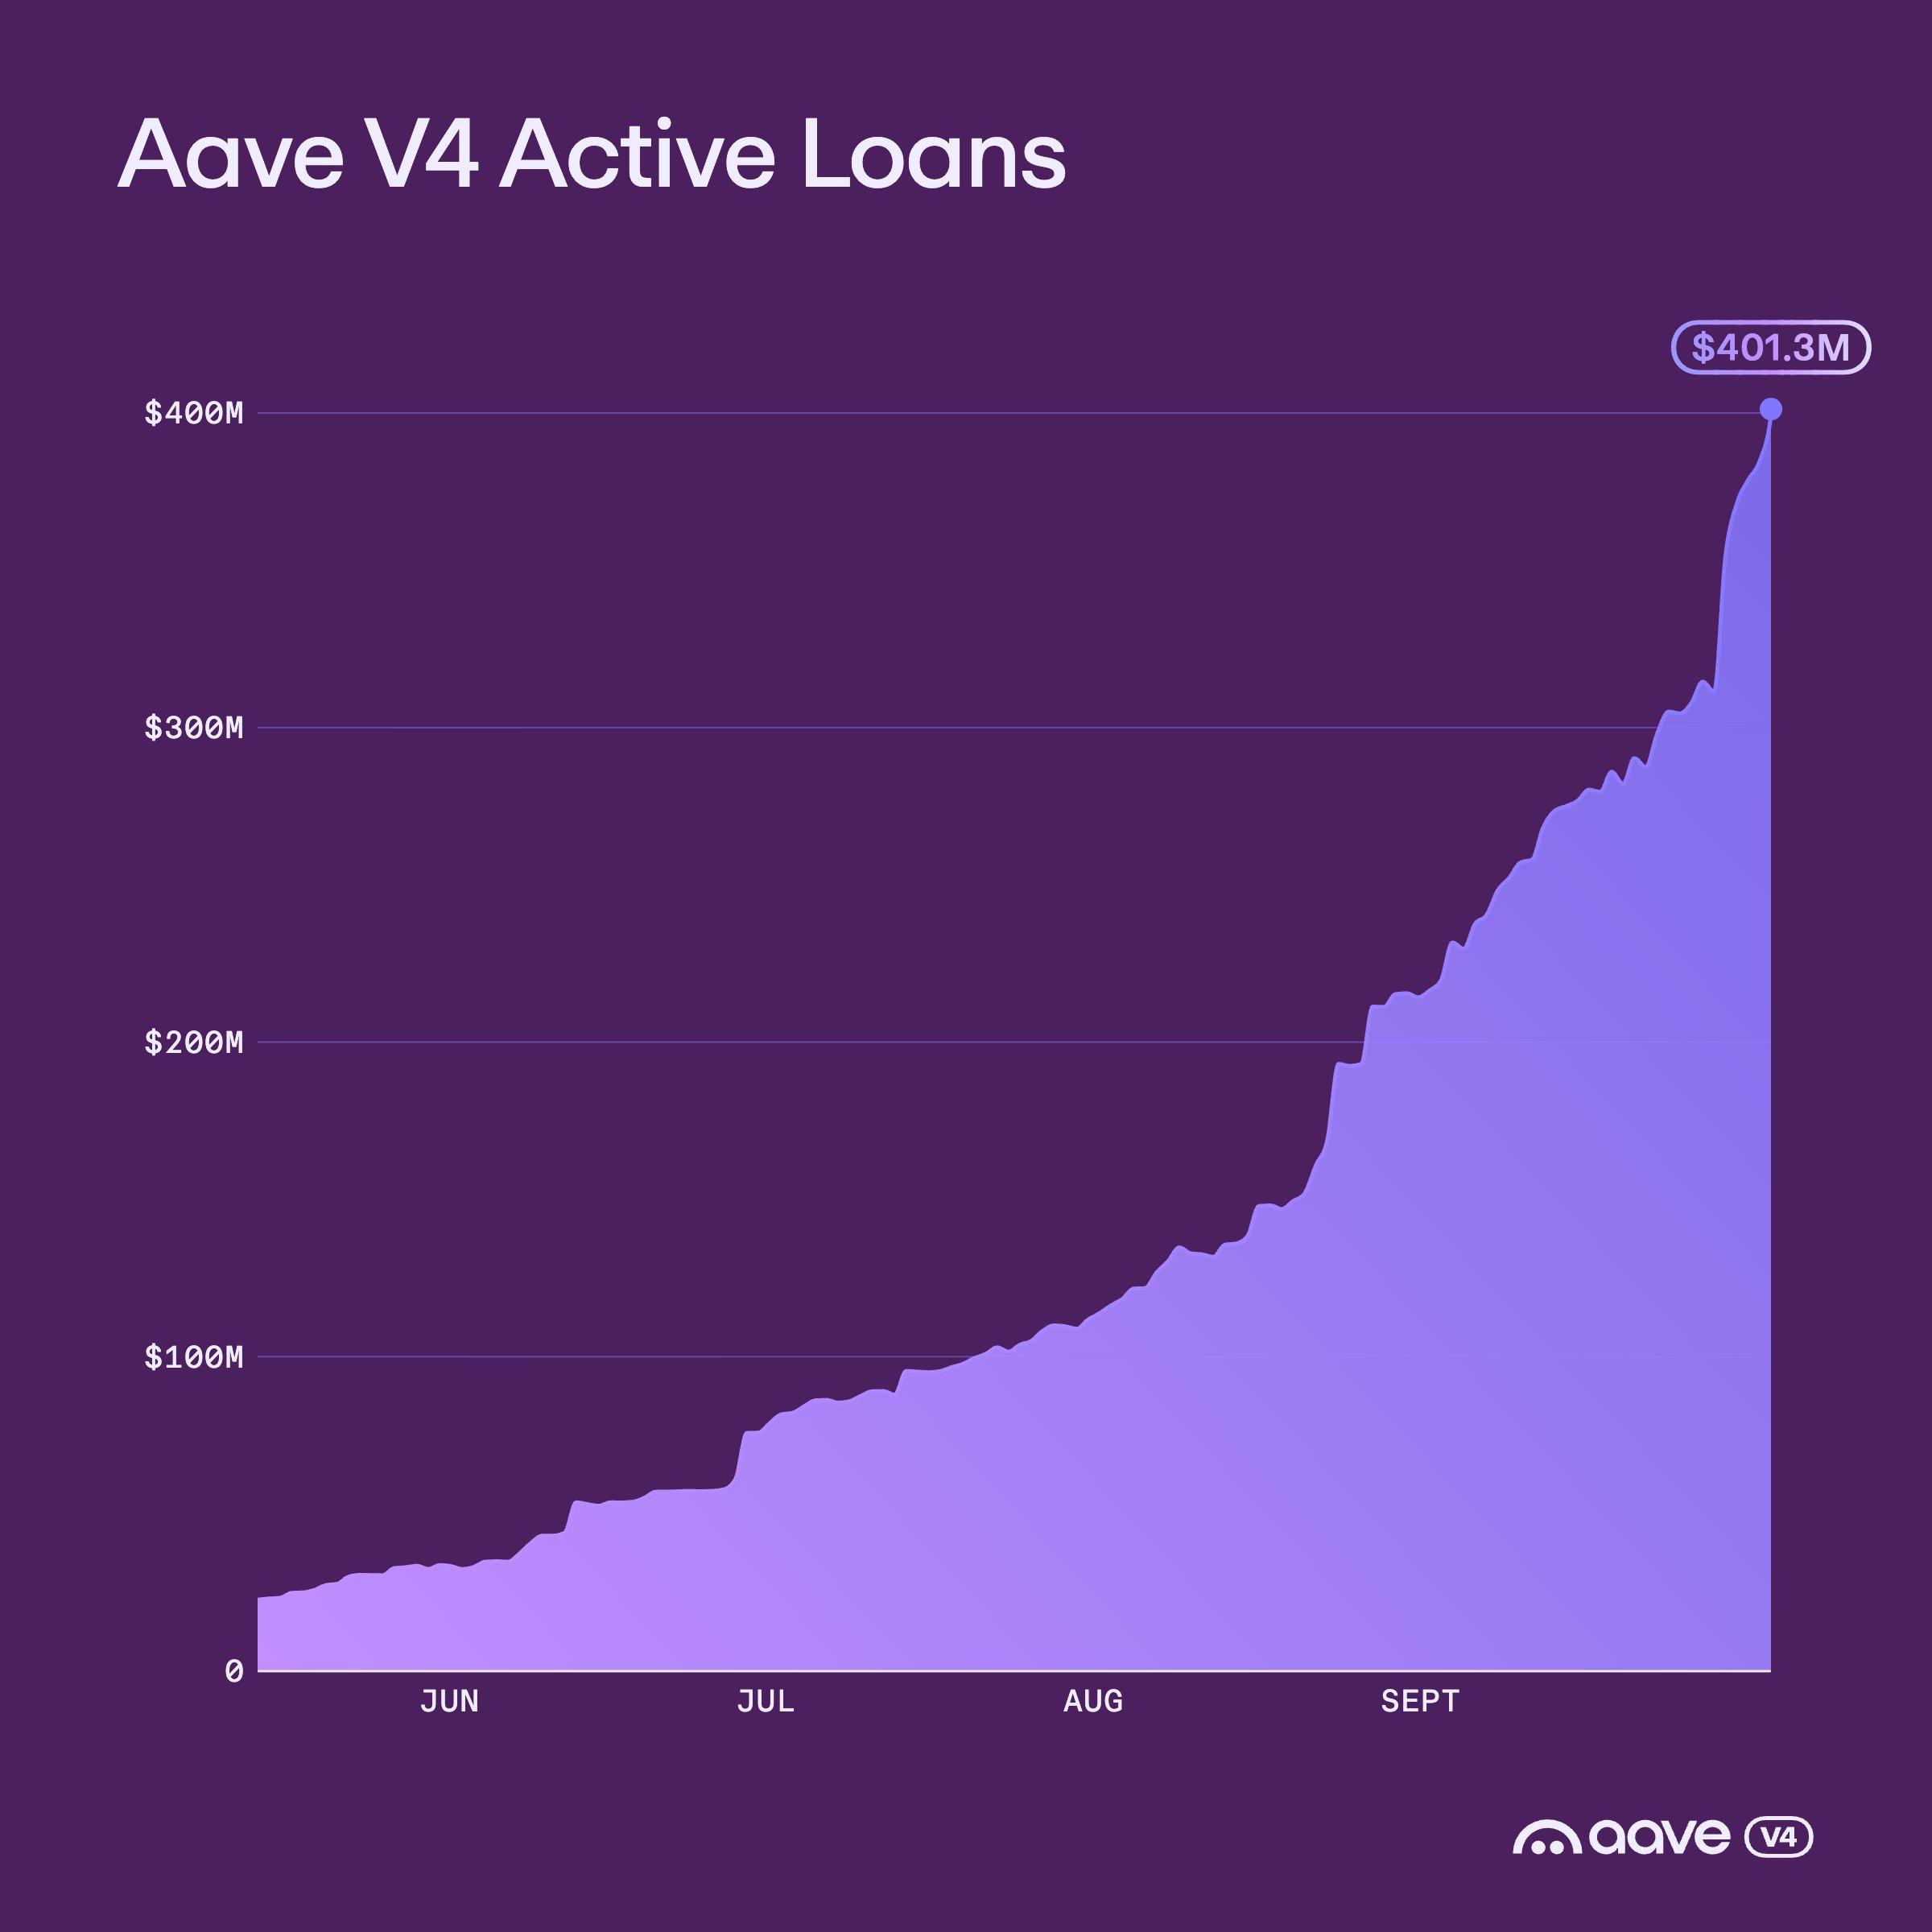
In addition, Aave posted on its X account on Wednesday that its V4 crossed $400 million in active loans, further highlighting strengthening demand and growing activity.
Aave technical outlook: Holds bullish bias
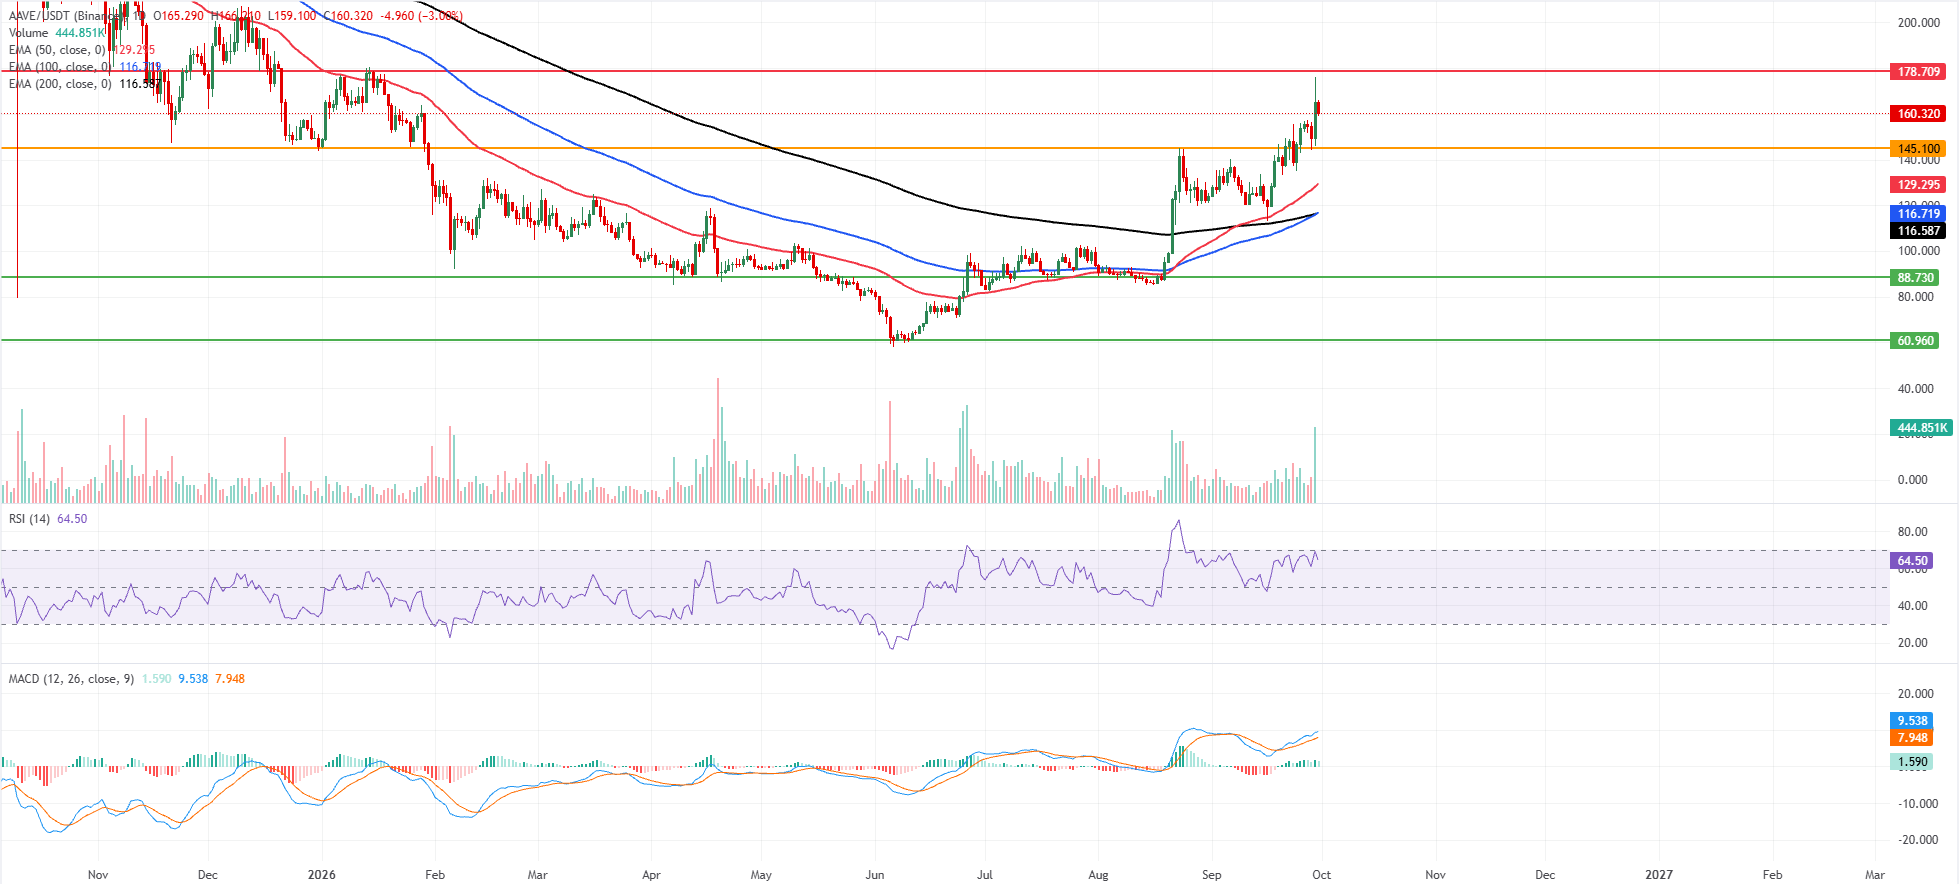
Aave price trades at $160.23 on Wednesday, maintaining a bullish near-term bias as price holds above the 50-day, 100-day and 200-day Exponential Moving Averages (EMAs), clustered between roughly $116.60 and $129.30.
The horizontal level at $145.10 underpins the recent breakout phase. At the same time, the Relative Strength Index (RSI) at 64 remains in bullish territory without reaching overbought, and the Moving Average Convergence Divergence (MACD) remains positive, suggesting upward momentum is still constructive.
On the topside, immediate resistance is seen at the horizontal barrier near $178.71, where buyers could face profit-taking.
On the downside, initial support appears at $145.10, followed by the 50-day EMA at $129.29 and then the 100-day and 200-day EMAs around $116.72 and $116.59, which together form a deeper demand zone; below these, older structural supports at $88.73 and $60.96 sit far beneath the current market price and would come into focus only in the event of a sharp reversal.
(The technical analysis of this story was written with the help of an AI tool. Know more.)
Recommended Articles









Comments (0)
Click the $ button, enter the symbol, and select to link a stock, ETF, or other ticker.