


Crypto Market Overview: Bitcoin slips to $84,000 on rate hike bets – Worldcoin, Pepe lead losses



- Bitcoin hovers around $84,000 on Thursday, facing downside risks after a 2% decline the previous day.
- The US composite and services PMIs rose in September, raising inflation concerns.
- Worldcoin and Pepe record double-digit losses over the last 24 hours, emerging as the worst performers.
Bitcoin (BTC) price trades below $84,000 on Thursday, extending losses after a 2% decline the previous day. The pullback aligns with renewed inflation and rate-hike concerns, as US composite and services PMIs rose to 58.4 and 58.7 in September. Worldcoin (WLD) and Pepe (PEPE) recorded double-digit losses over the last 24 hours, emerging as the worst performers.
Crypto market risk-on sentiment takes a hit
The US composite and services PMIs rose to 58.4 and 58.7 in September, suggesting increased prices paid by businesses, as previously reported by FXStreet. This adds to inflation concerns and increases the odds that the US Federal Reserve (Fed) will raise interest rates at its October meeting.
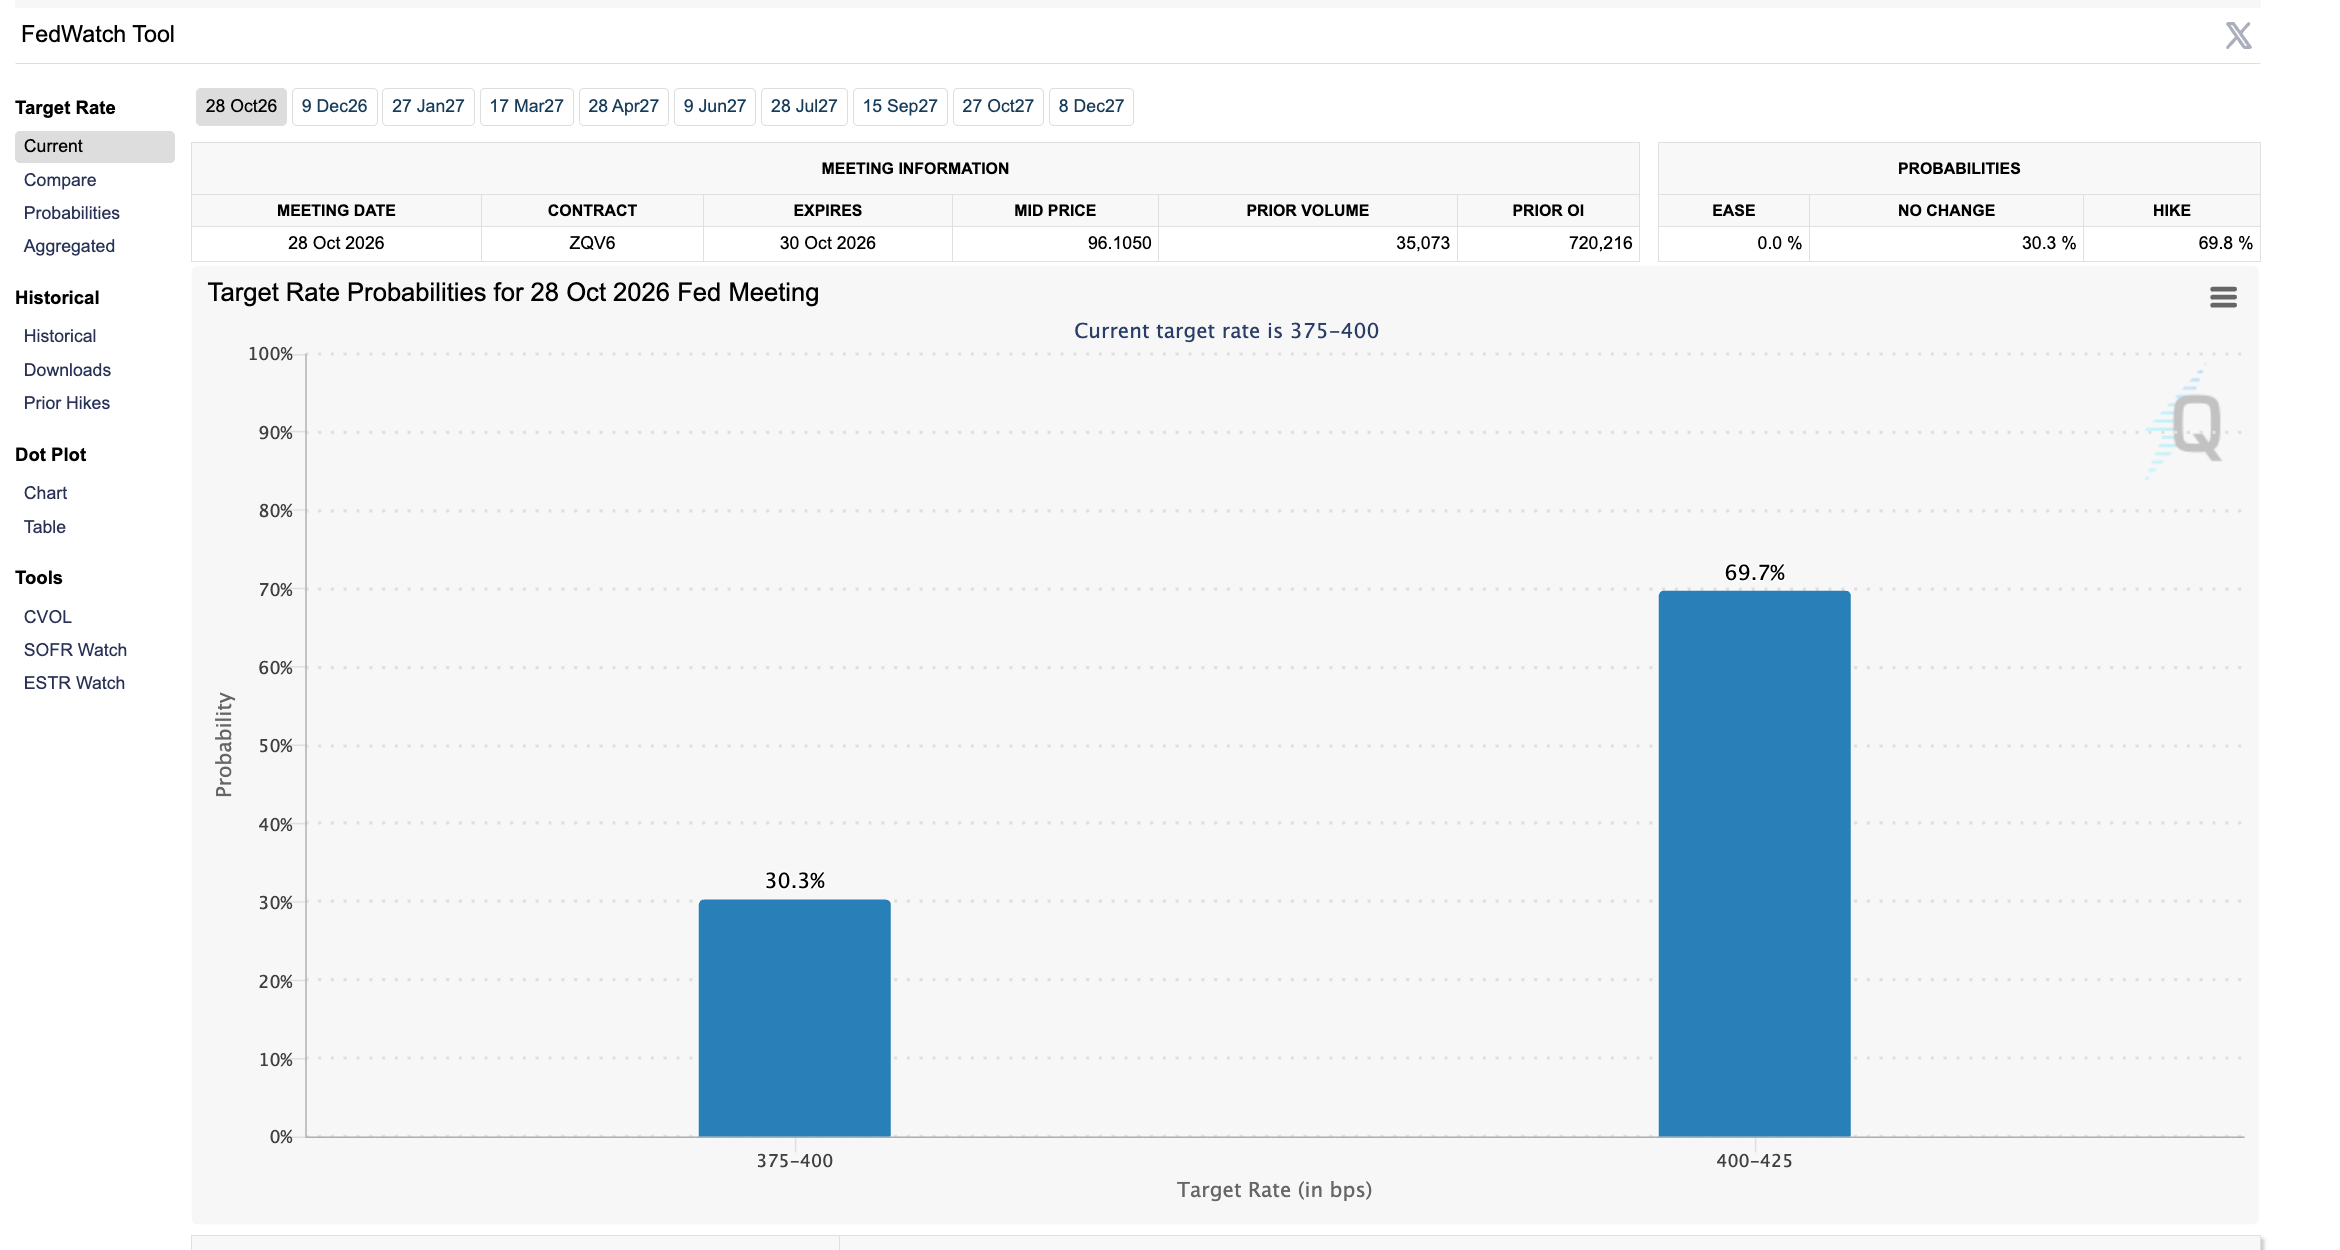
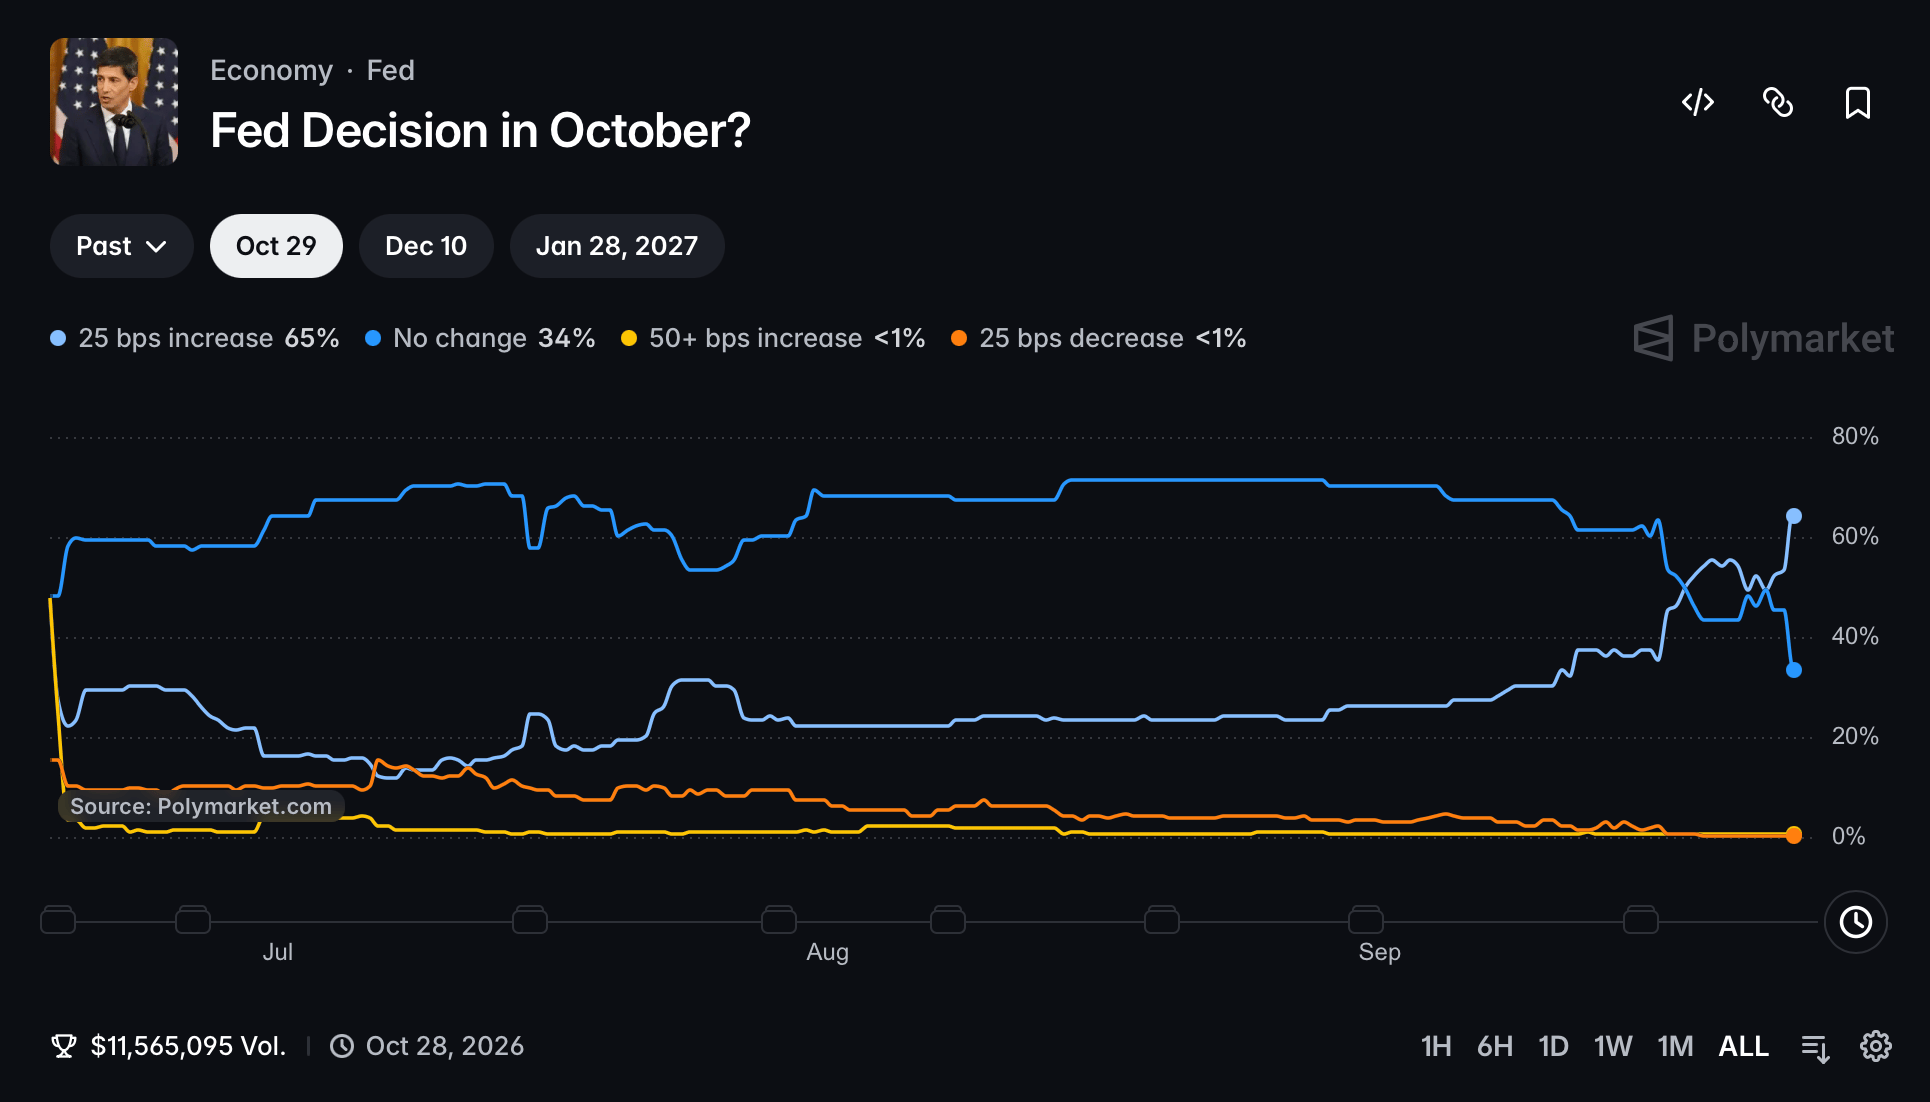
The FedWatch Tool indicates a roughly 70% probability that the Fed could raise rates by 25 basis points (bps) to the 400-425 bps range. Supporting the odds, Polymarket bets on “Fed Decision in October?” totaling $11.56 million in volume indicate a higher likelihood of a 25 bps rate hike, while rate-cut odds are down to less than 1%.
Bitcoin risks a steeper decline below $84,000
Bitcoin trades around $83,915 at press time on Thursday, trading in the red for the third consecutive day. Still, BTC maintains a long-term upside bias, trading above the 50-, 100-, and 200-day Exponential Moving Averages (EMAs) at $76,122, $73,074, and $76,122, respectively.
The Relative Strength Index (RSI) at 63 on the daily chart slips below the overbought zone, while the Moving Average Convergence Divergence (MACD) holds above the signal line as the histogram profile wanes, suggesting easing upside tone.
On the downside, initial support emerges at the reclaimed $82,500 level, followed by the 50% retracement measured from $97,924 to $57,800 at $75,233 and the 50-day EMA at $76,122.
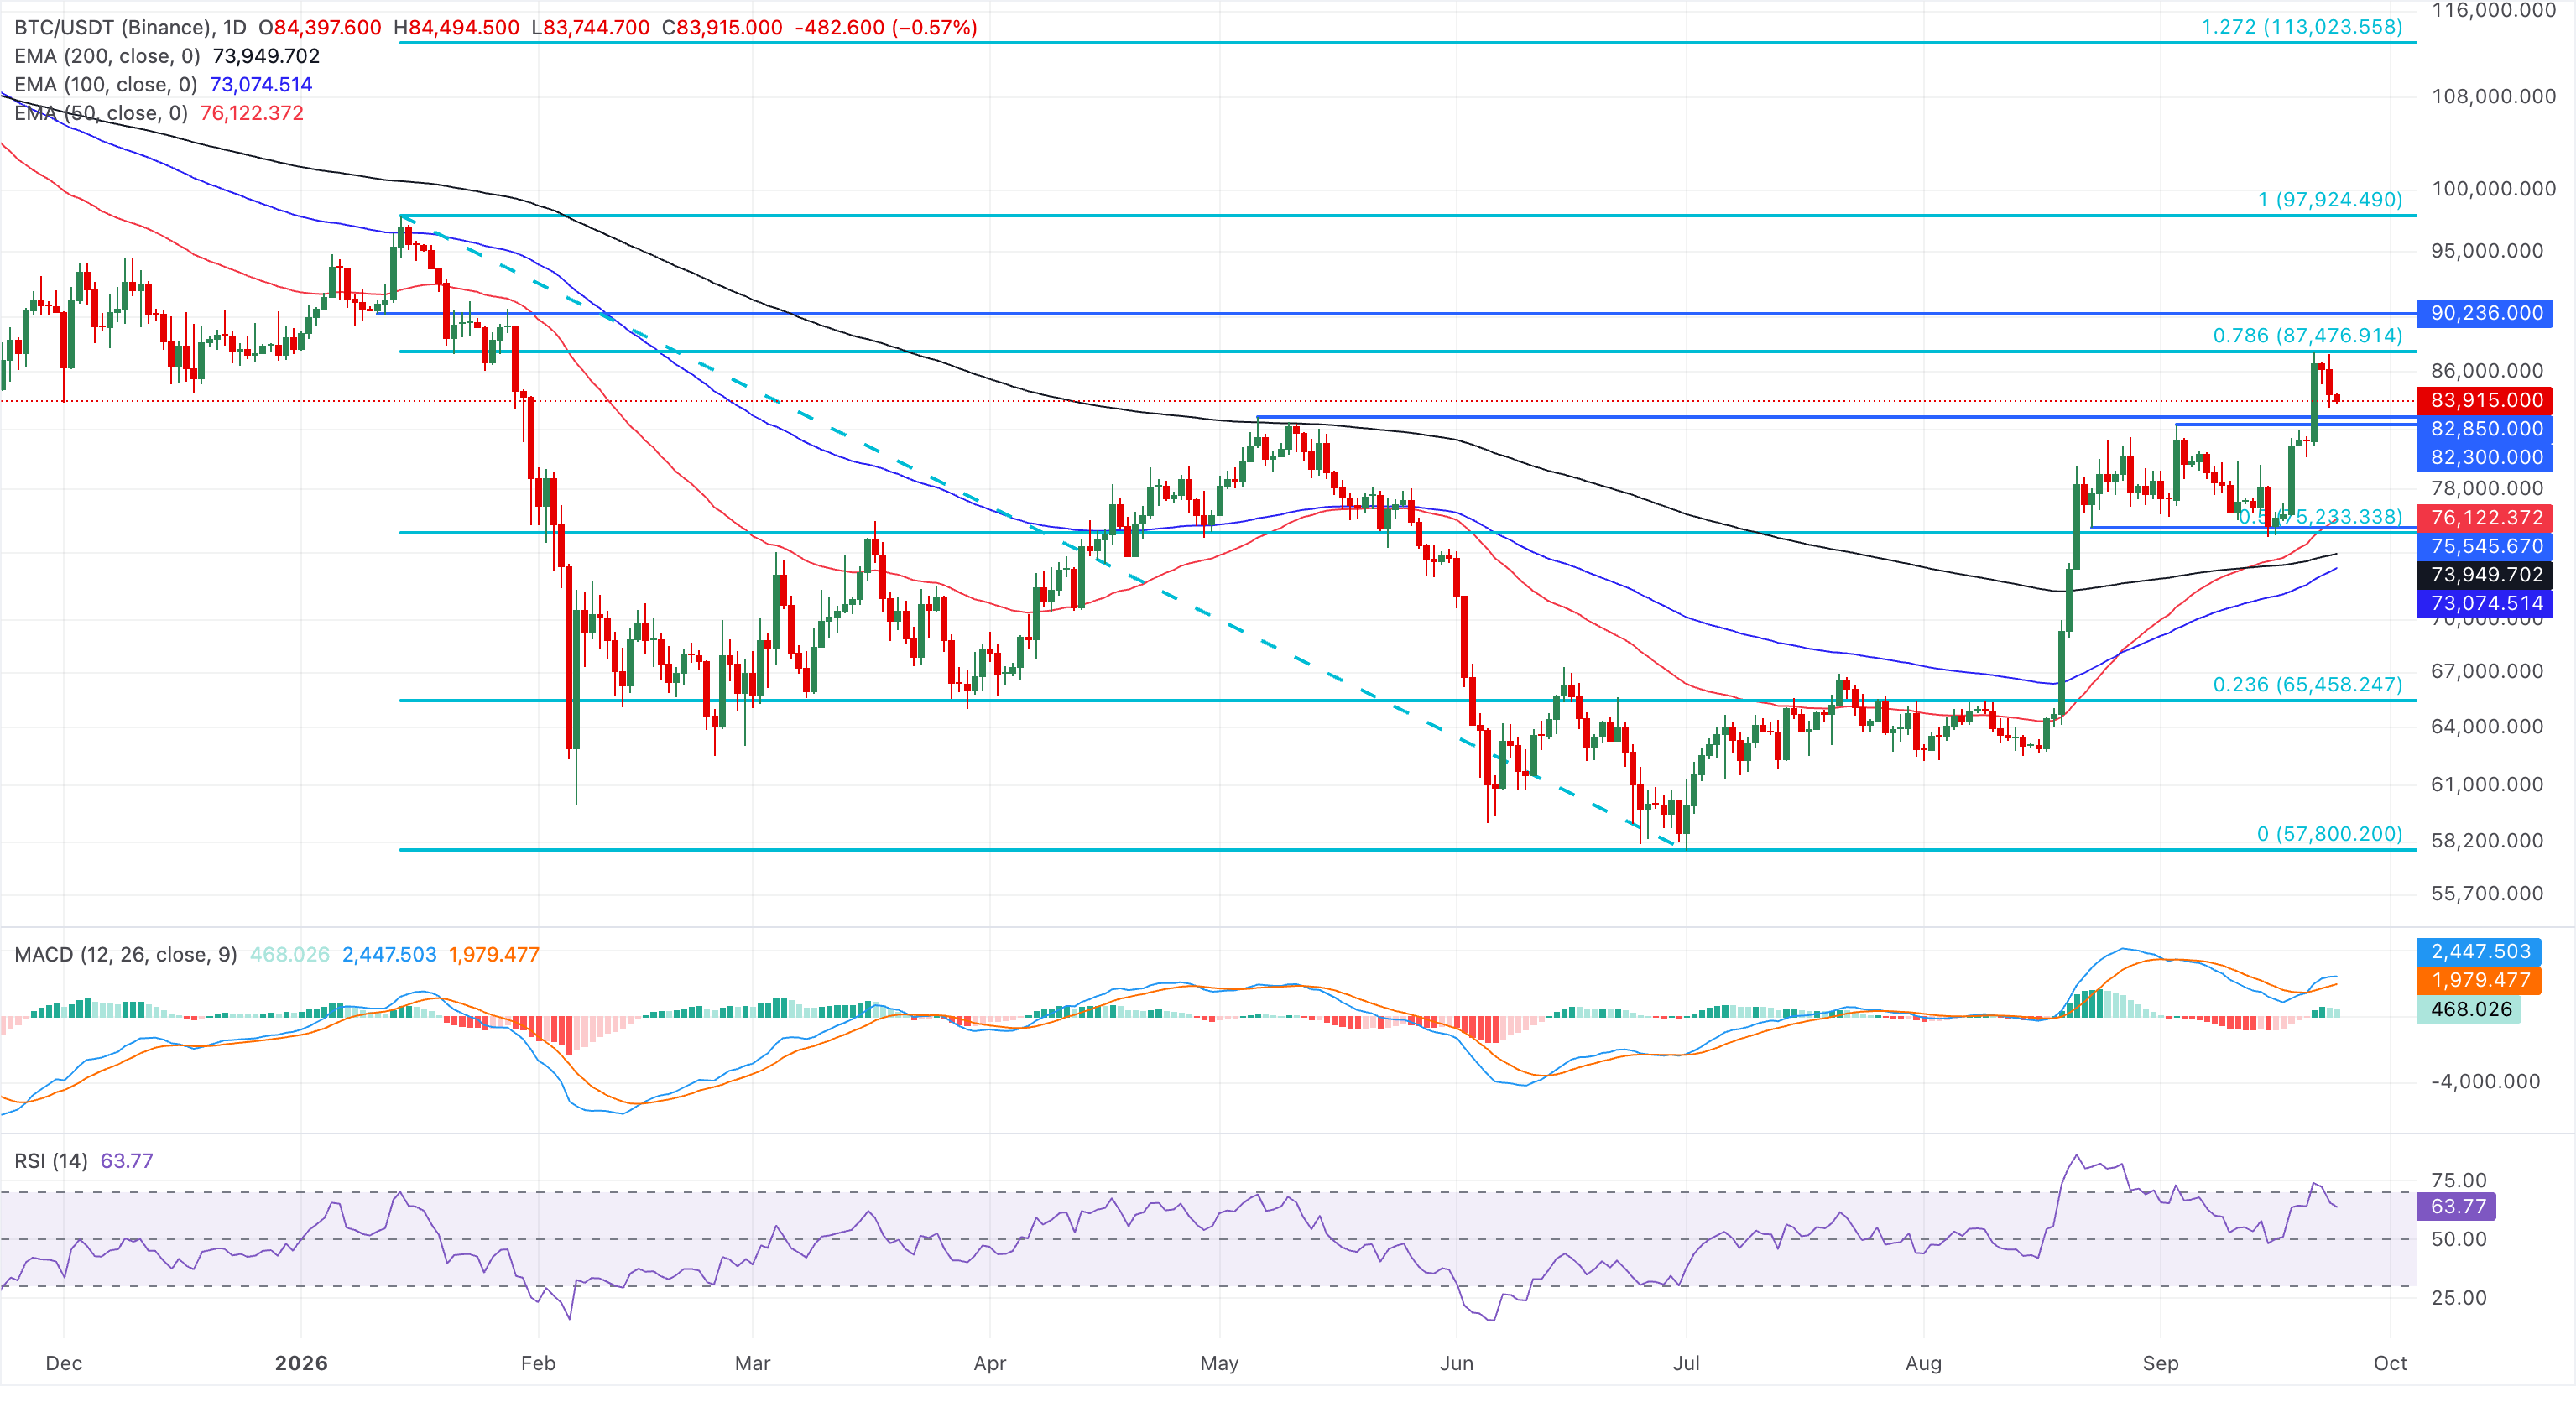
Bitcoin faces immediate resistance at the 78.6% Fibonacci retracement level, at $87,476. A confirmed breakout above this level could target the $90,000 round figure, followed by the Fibonacci anchor at $97,024.
Worldcoin and Pepe face downside risks
Worldcoin hovers around $0.4000 at press time on Thursday, holding above the 50-day and 100-day EMAs at $0.3948 and $0.3891, respectively, but still capped beneath the 200-day EMA at $0.4189. This configuration keeps the near-term tone broadly neutral, with price caught between trend support from the rising trendline near $0.3700 and a nearby overhead barrier near the September 7 high at $0.4810.
The MACD remains marginally above the signal, while the RSI sits close to 50, both hinting at a consolidative phase on the verge of shifting bearish.
Looking down, initial demand is aligned with the 50-day EMA at $0.3948, with the 100-day EMA at $0.3891 providing a secondary cushion.
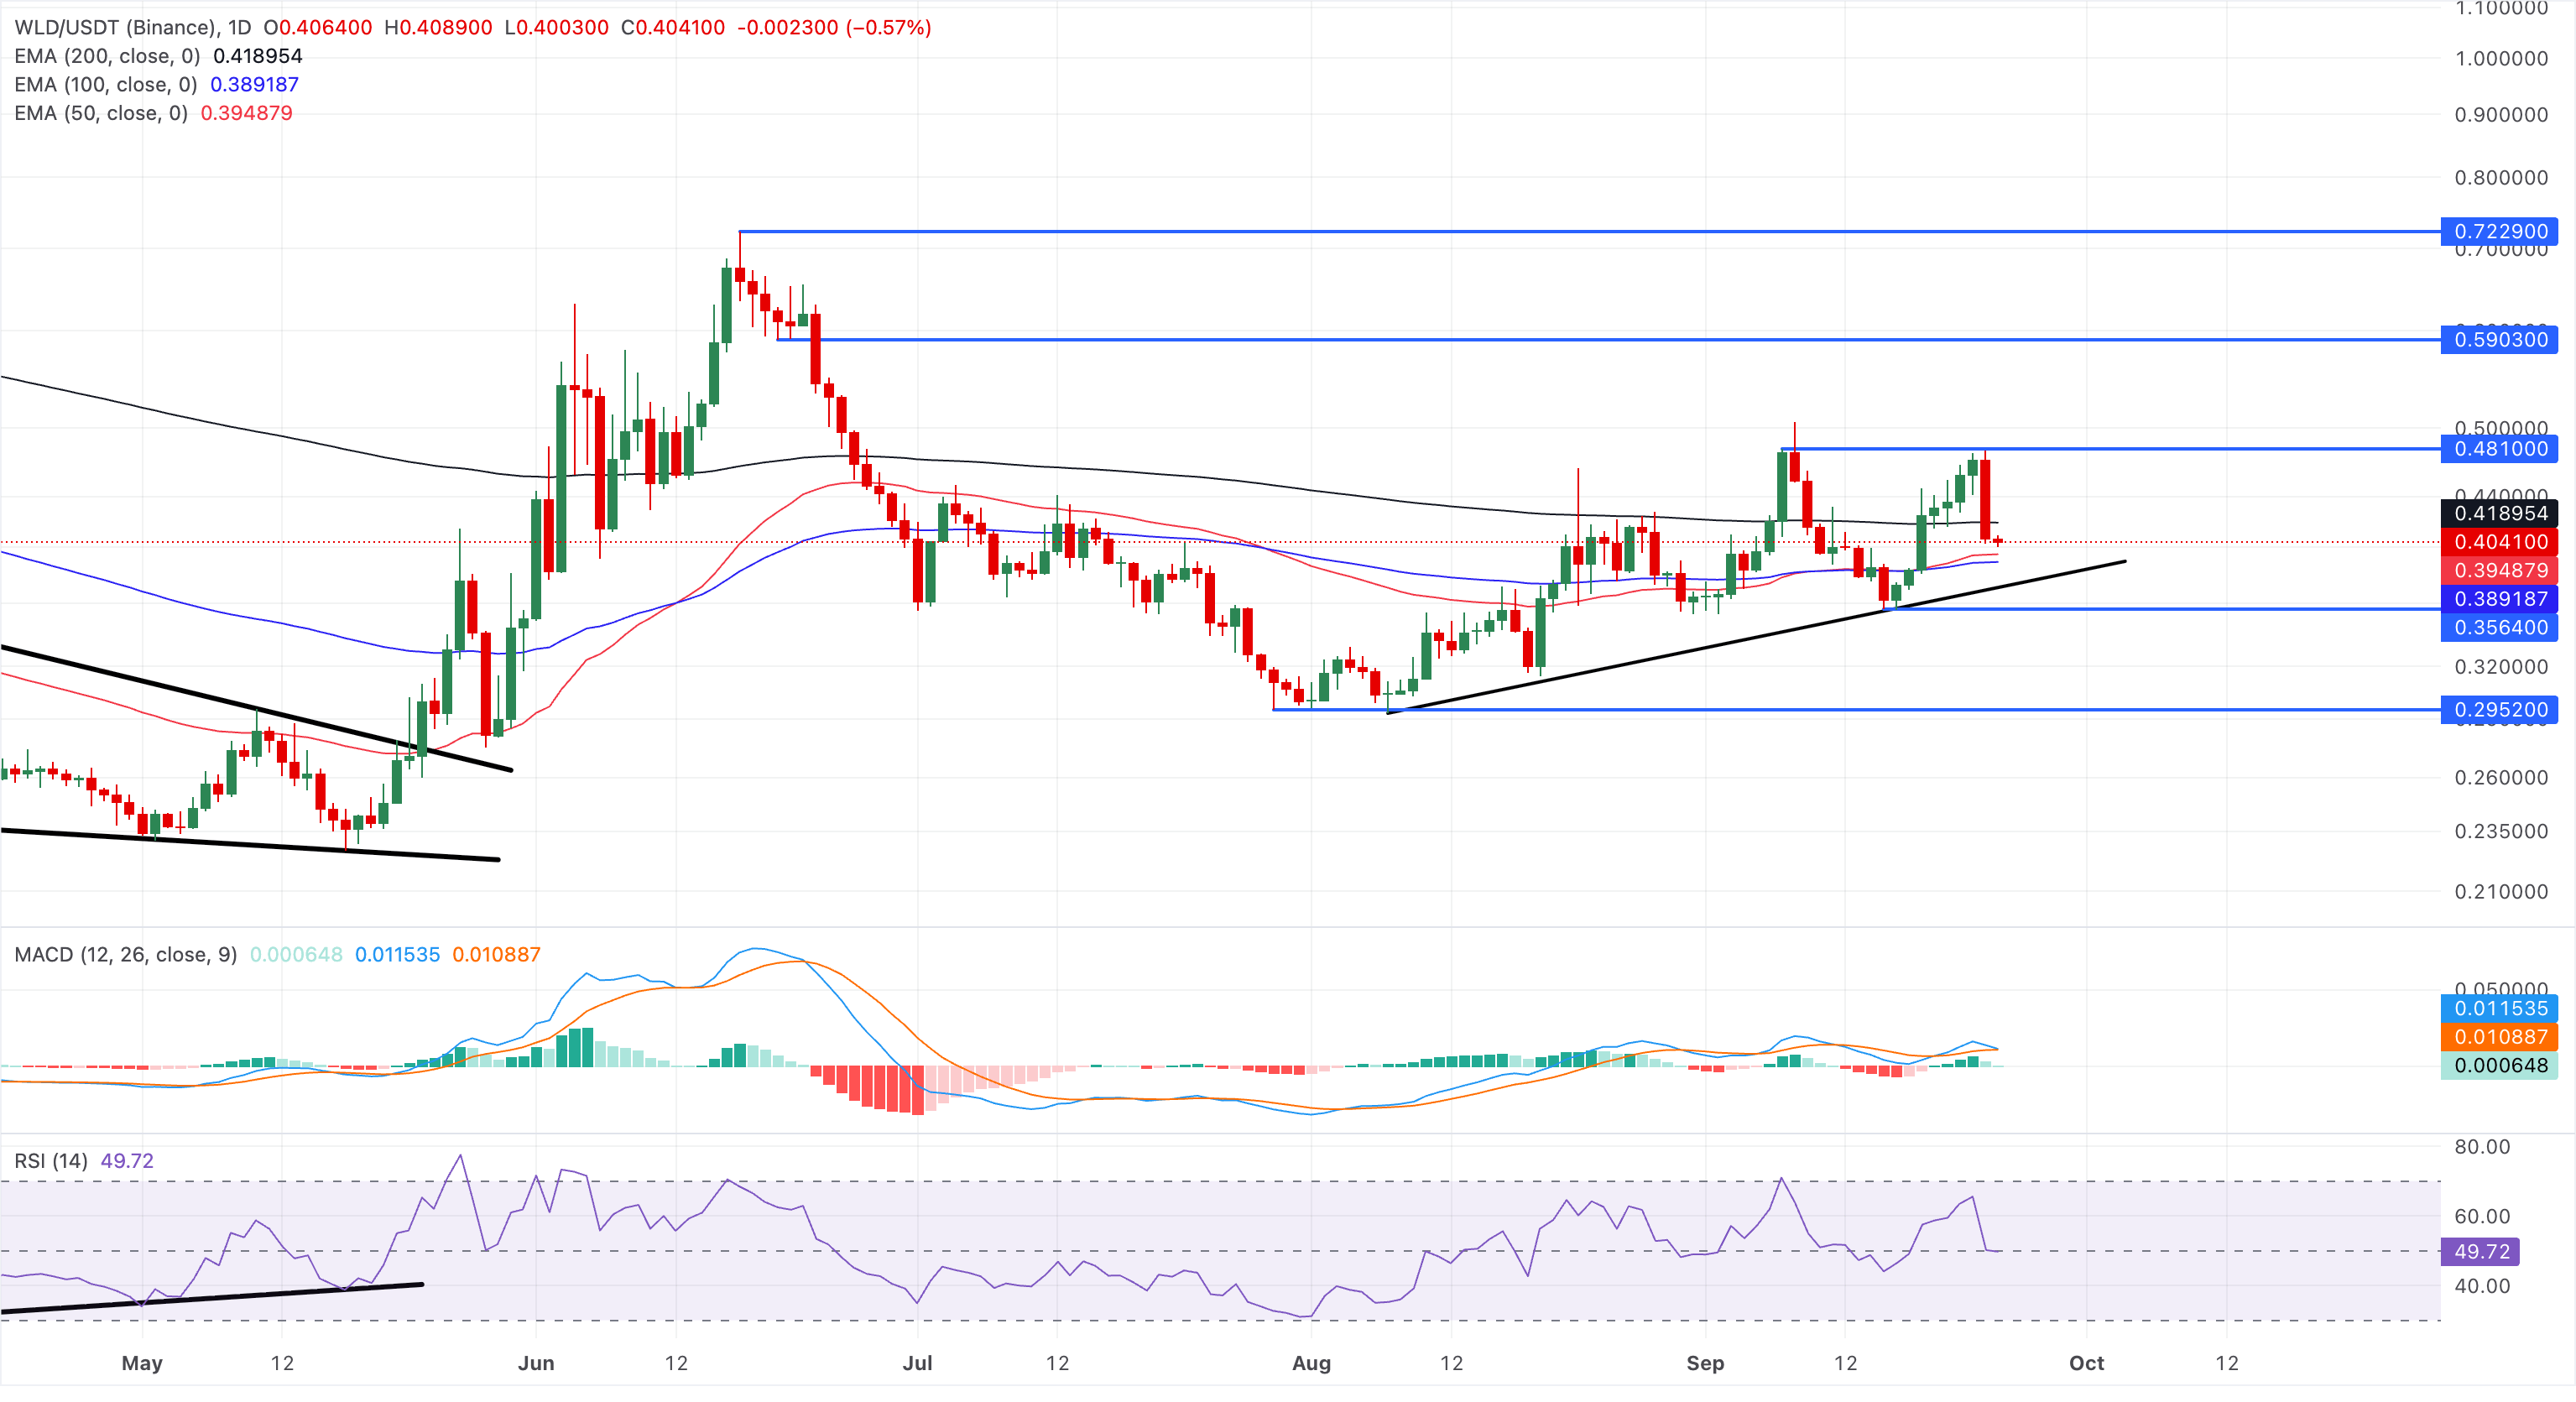
On the topside, immediate resistance is seen at the September 7 high of $0.4810, which capped gains on Tuesday.
Pepe holds steady around $0.00000430 on Thursday, following a 13% decline the previous day. The meme coin risks a steeper correction toward the broken long-term resistance trendline, connecting the July 22, 2025, and September 13, 2025, highs, near $0.00000414.
A steeper correction below the trendline could test the 50-day EMA at $0.00000357.
The RSI is down to 60 from overbought territory, hinting that the latest momentum push has run into exhaustion.
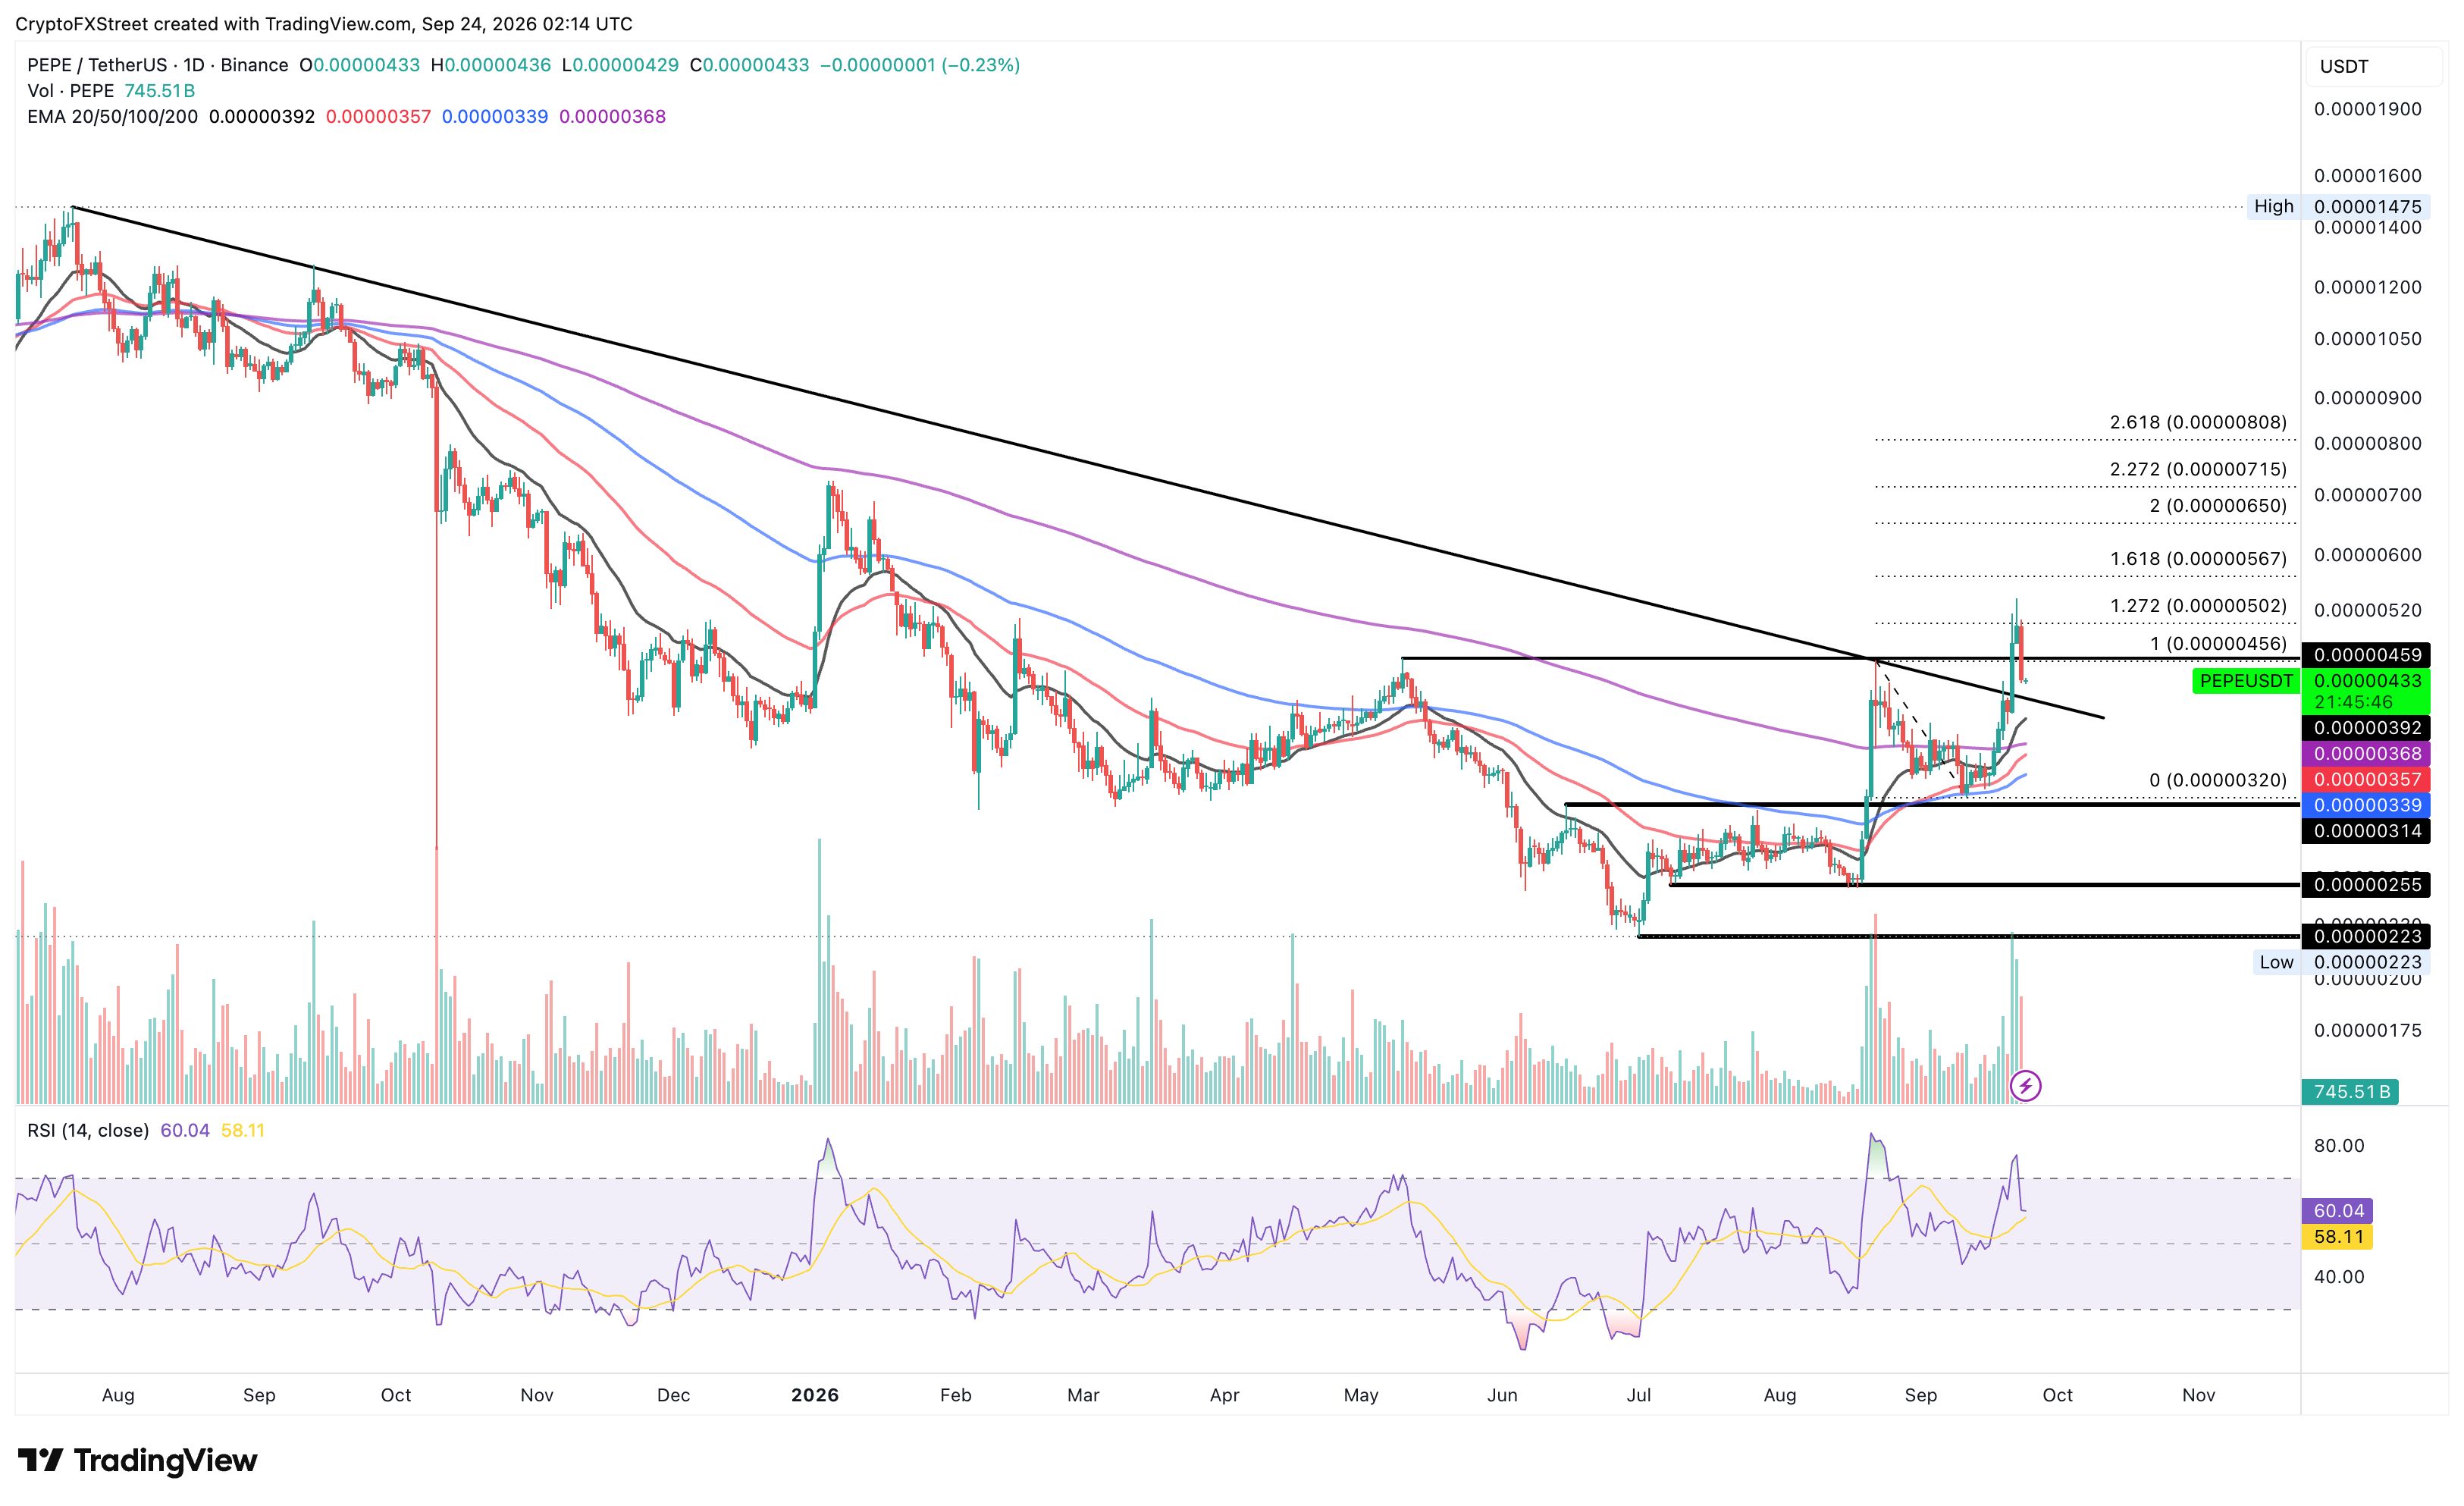
Looking up, the previous swing high near $0.00000456 could serve as the immediate barrier, which PEPE must reclaim to reinforce an upward trend.
(The technical analysis of this story was written with the help of an AI tool. Know more.)
Recommended Articles










Comments (0)
Click the $ button, enter the symbol, and select to link a stock, ETF, or other ticker.