


Ethereum Price Forecast: ETH rallies above $2,700 as investors shrug off bearish sentiment



Ethereum price today: $2,770
- Ethereum climbs above $2,700 following a strong bounce near investors' average on-chain acquisition cost.
- US sentiment has trended upward, showing an upside bias over the past few days.
- ETH is facing resistance near $2,786 after its recent rally.
Ethereum (ETH) climbed above $2,700 on Monday after investors defended the realized price level despite negative sentiment over the Clarity Act's failure and the Federal Reserve rate hike.
After the Clarity Act failed to advance in the Senate, ETH dipped below $2,400 last week. But right below that price is the top altcoin's realized price, or average on-chain cost basis, at $2,310.
Investors quickly initiated buying pressure near the level, pushing ETH above $2,700. With investors defending the realized price instead of selling near it, the move indicates an upside bias amid a consolidation over the past week.
Despite the price strength, key metrics show mixed reactions from active traders.
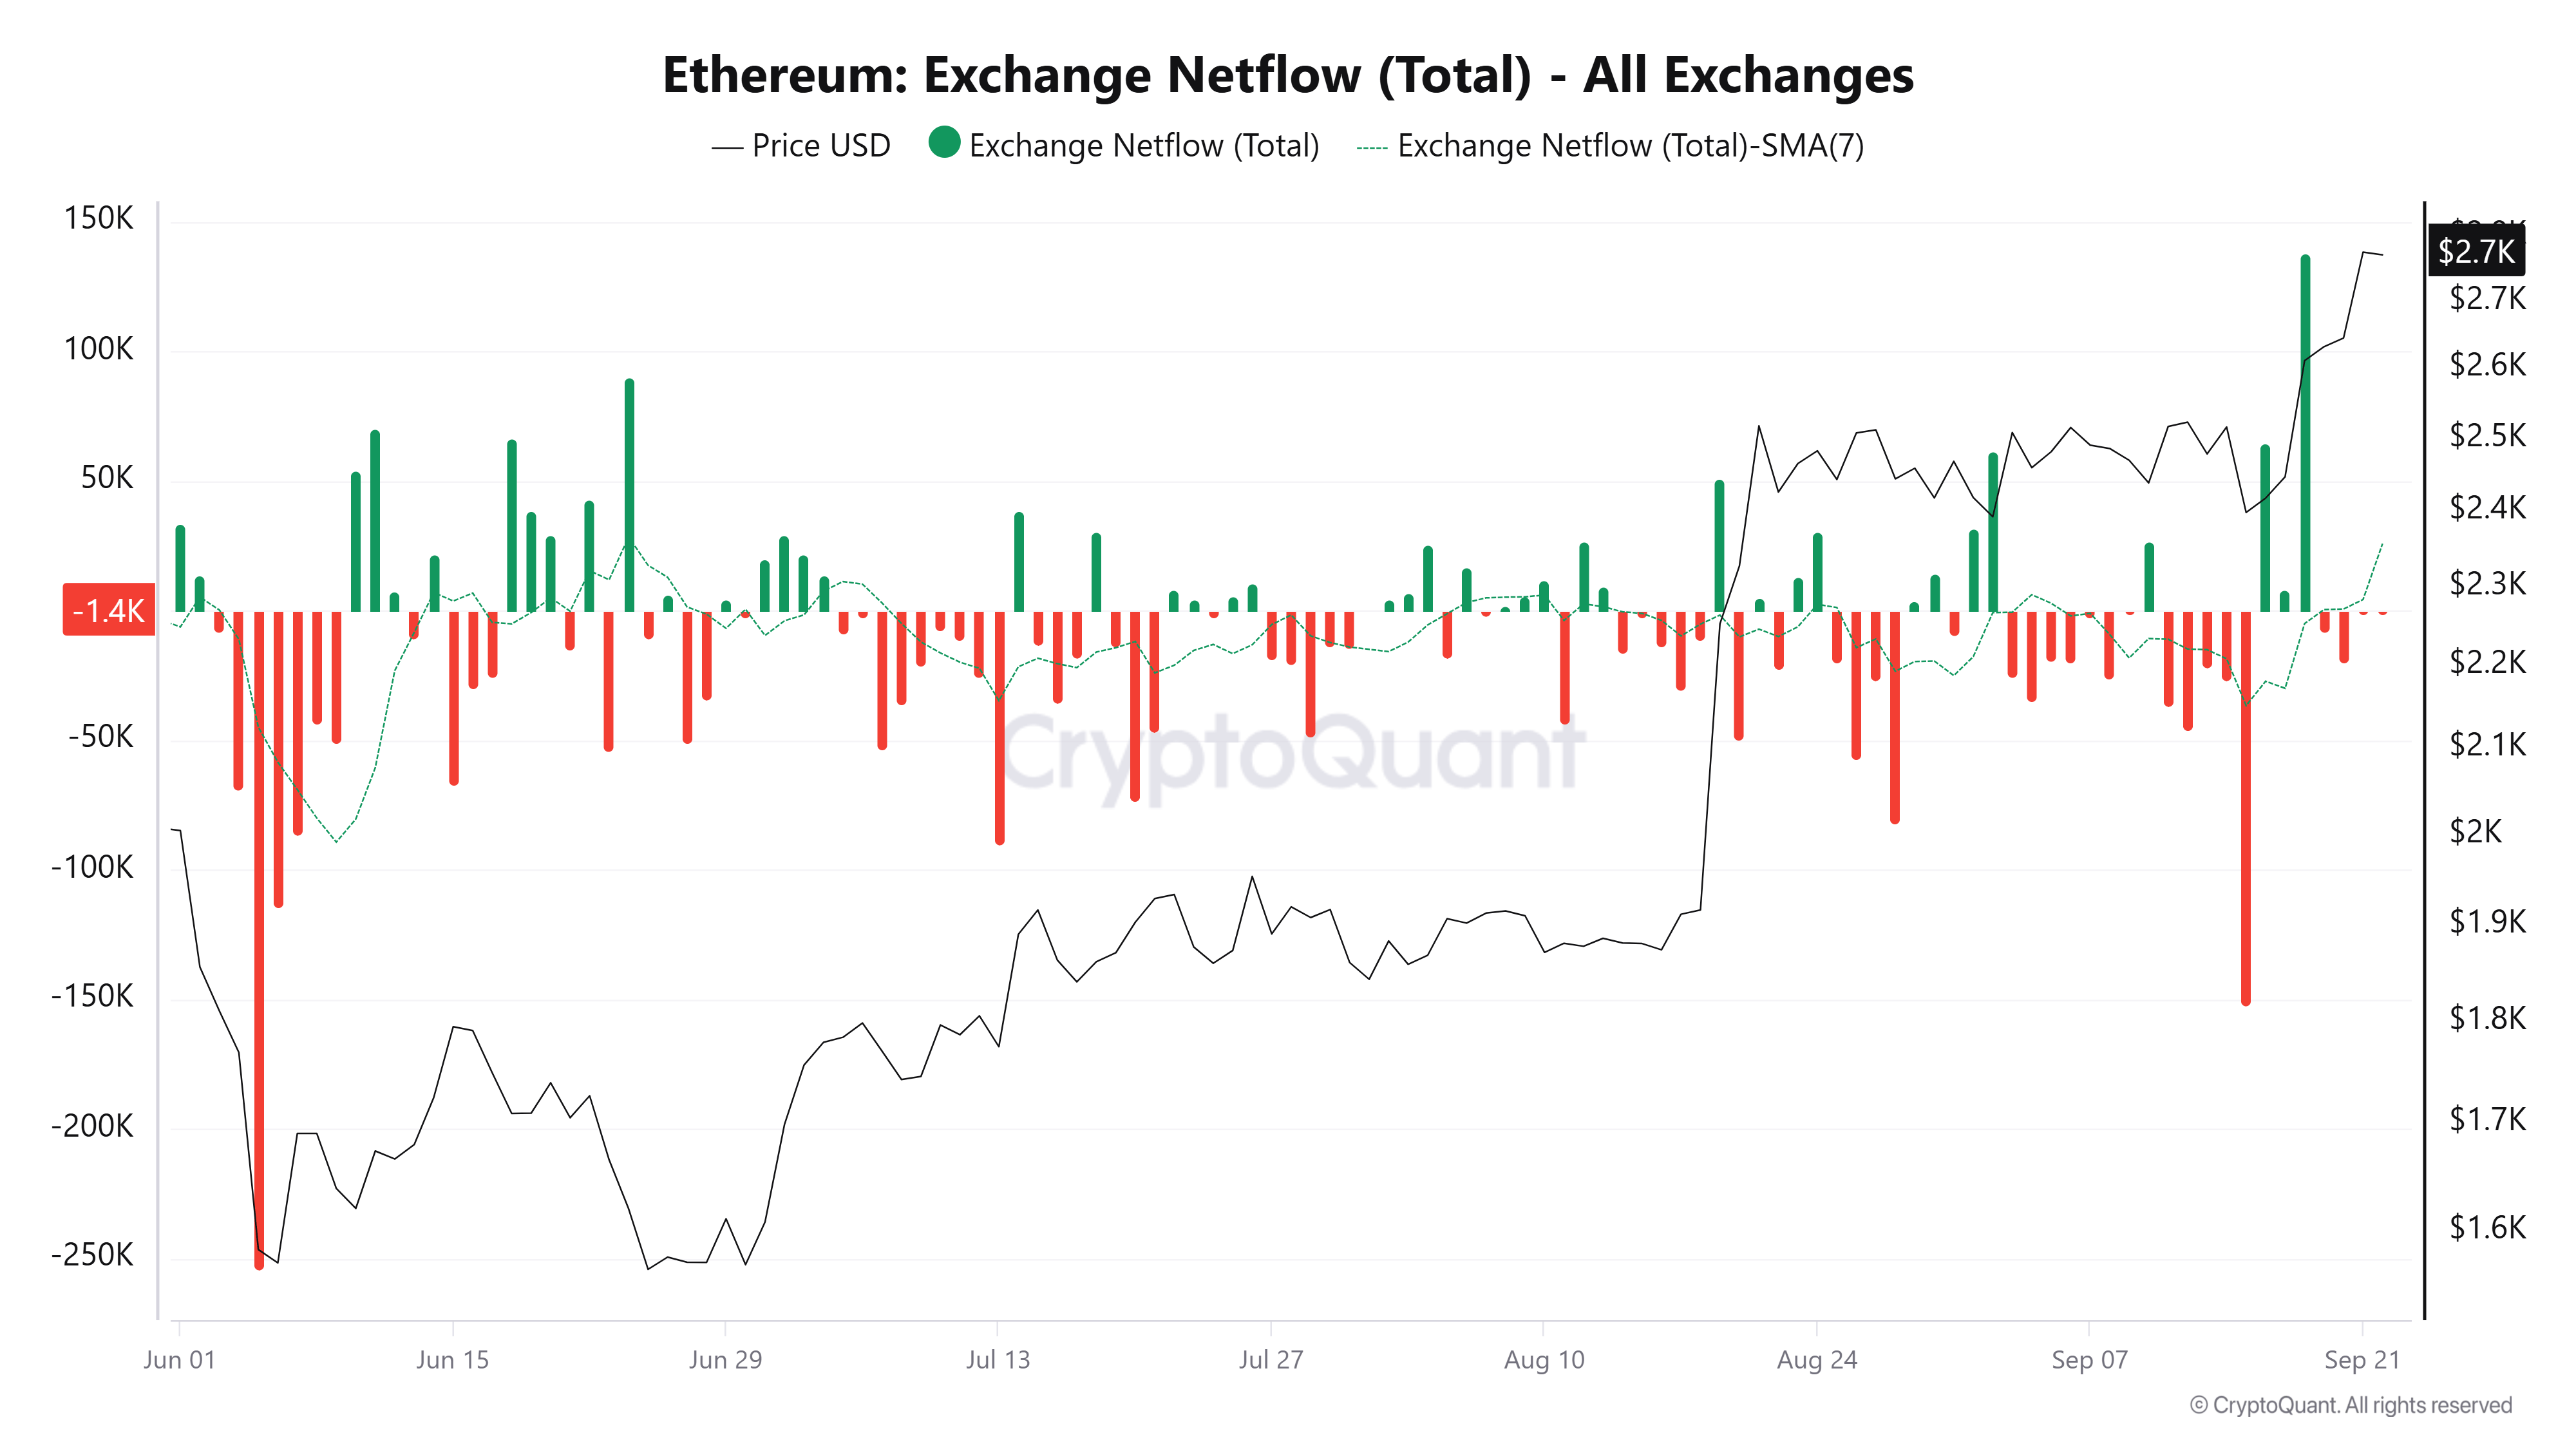
The ETH Exchange Netflow metric shows deposits into crypto exchanges have outpaced withdrawals over the past few days, suggesting potential for higher selling pressure. This indicates some investors are selling into recent gains, reflecting cautious sentiment among these groups, as no immediate bullish catalysts are in sight.
On the US spot ETH ETF side, however, sentiment flipped positive after three days of outflows. The products recorded $143.8 million in net inflows on Friday, ending the week on a positive note.
Similarly, the Coinbase Premium Index, an indicator of US investors' sentiment, is trending upward again after days of declines, though it remains in negative territory.
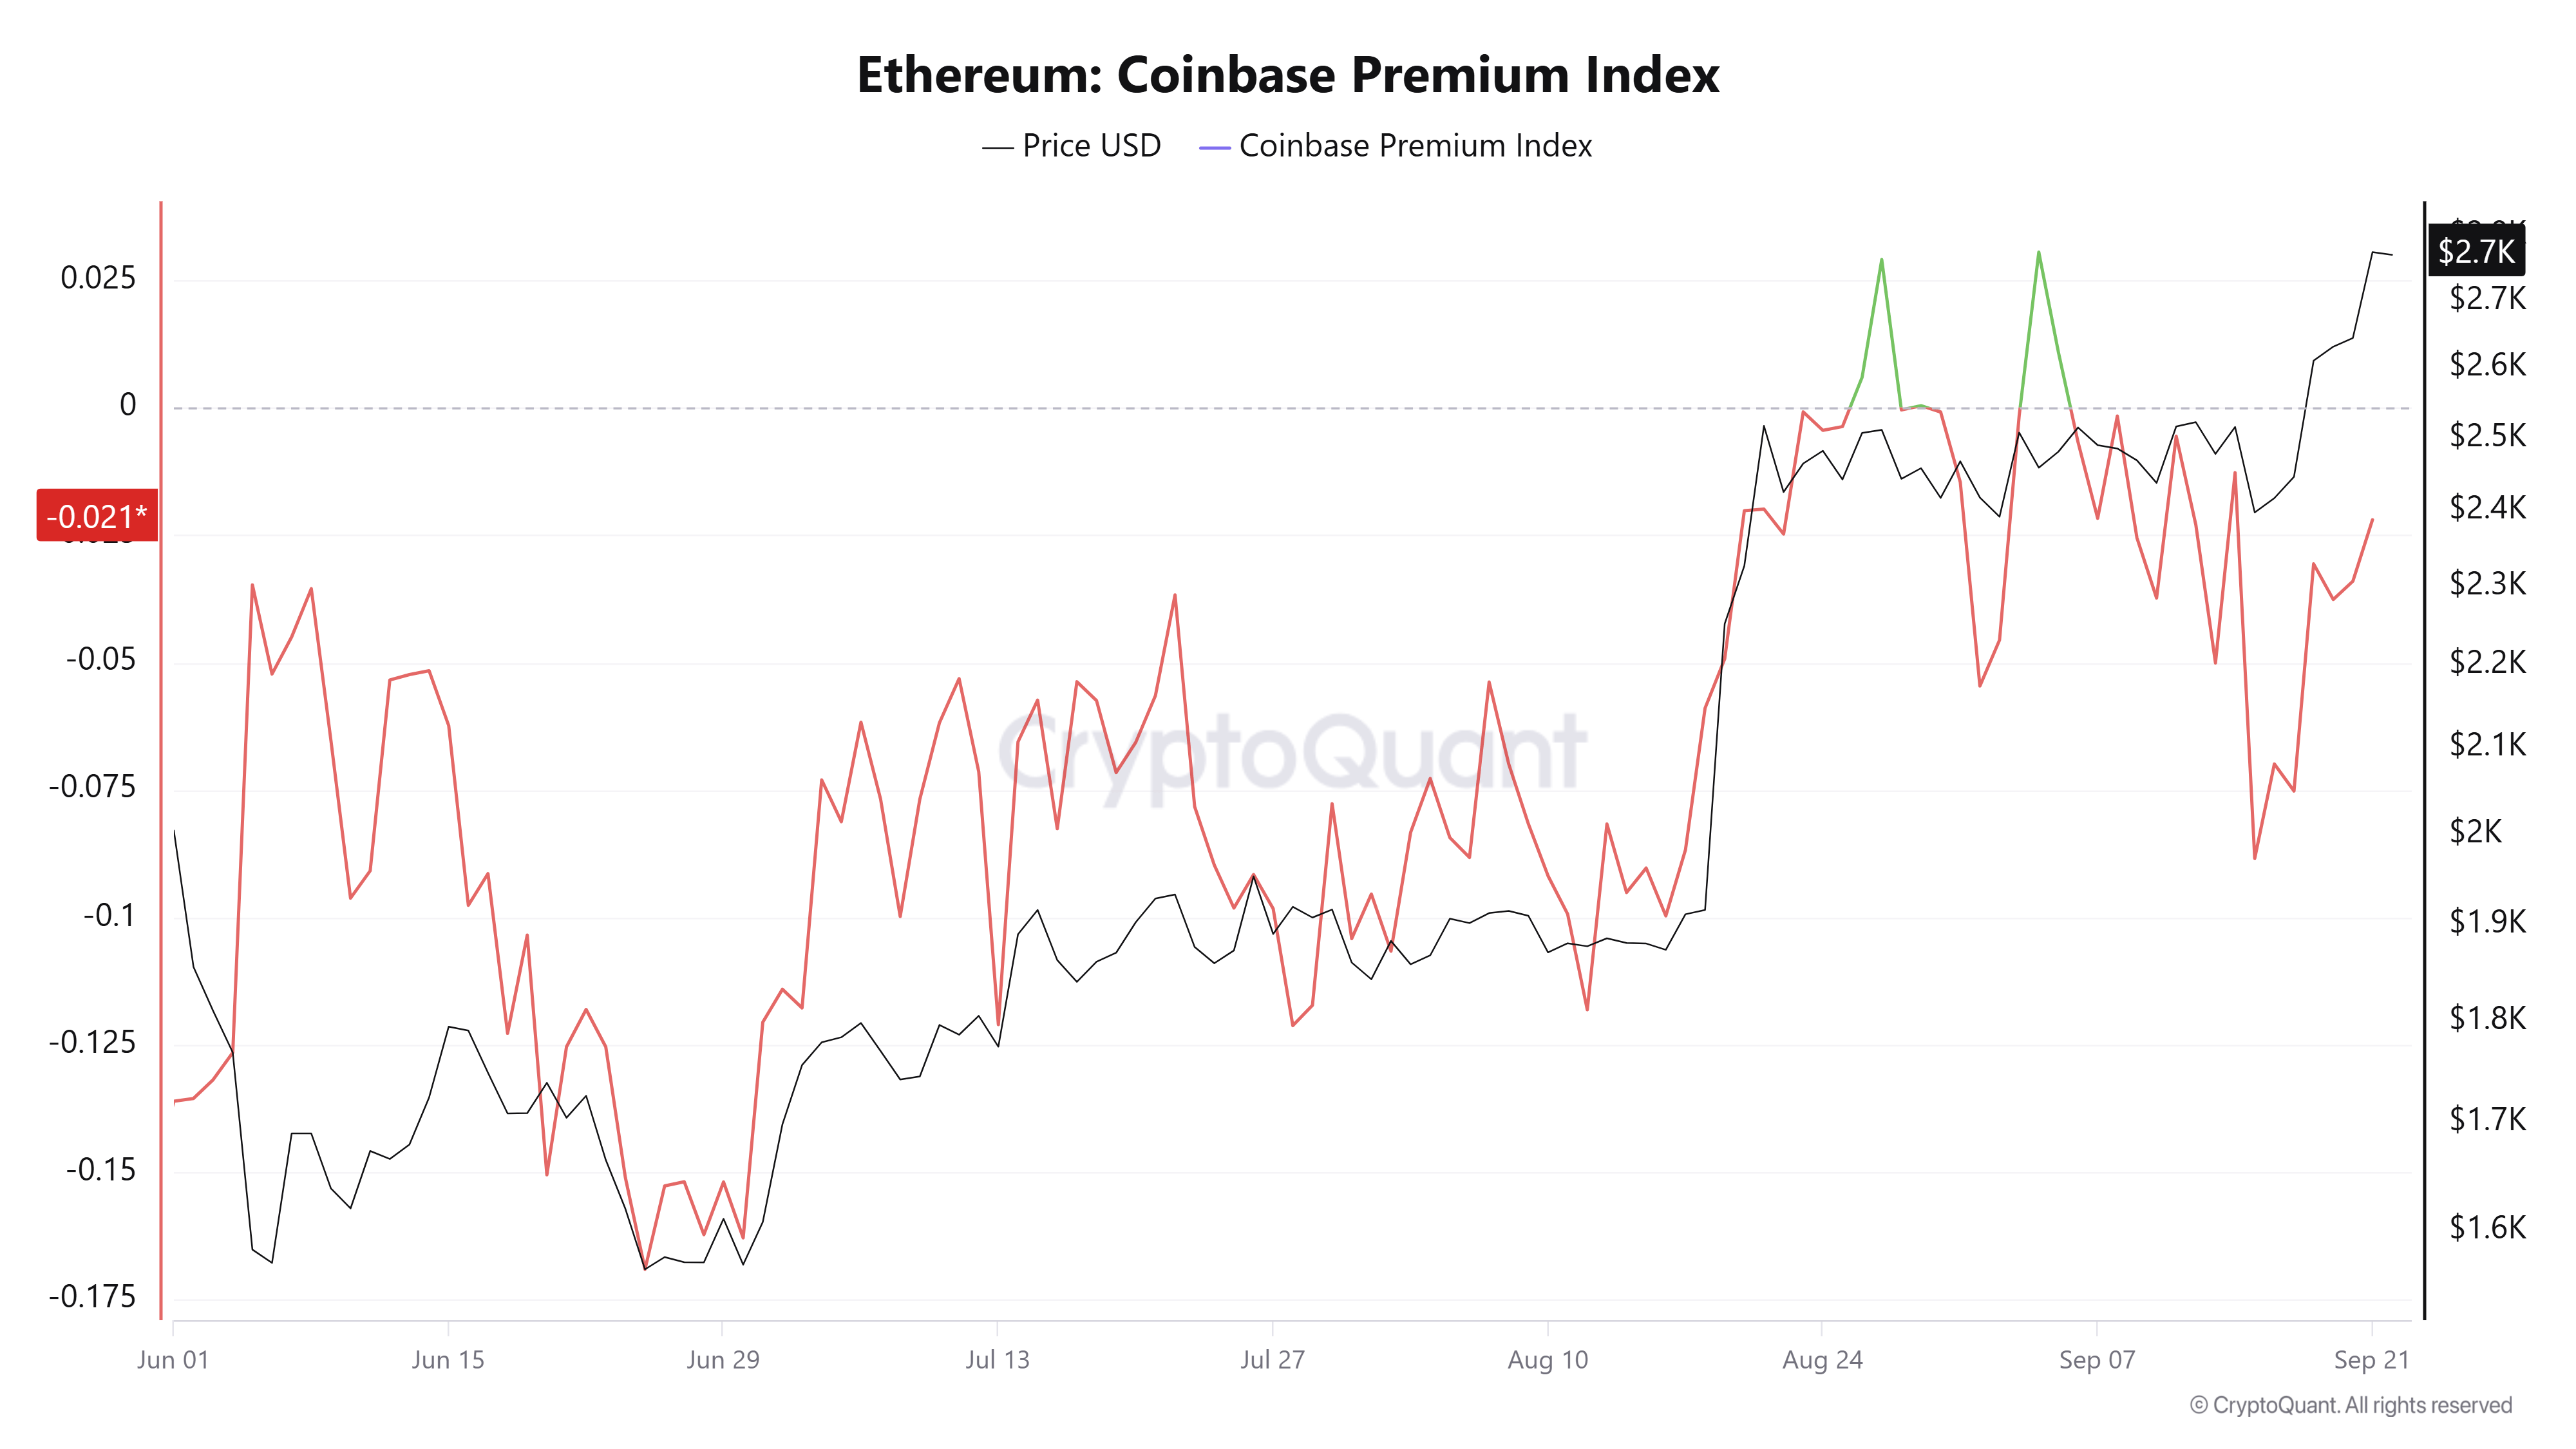
The move shows US-based investors are shrugging off bearish sentiment from the Clarity Act's failure and rate hike.
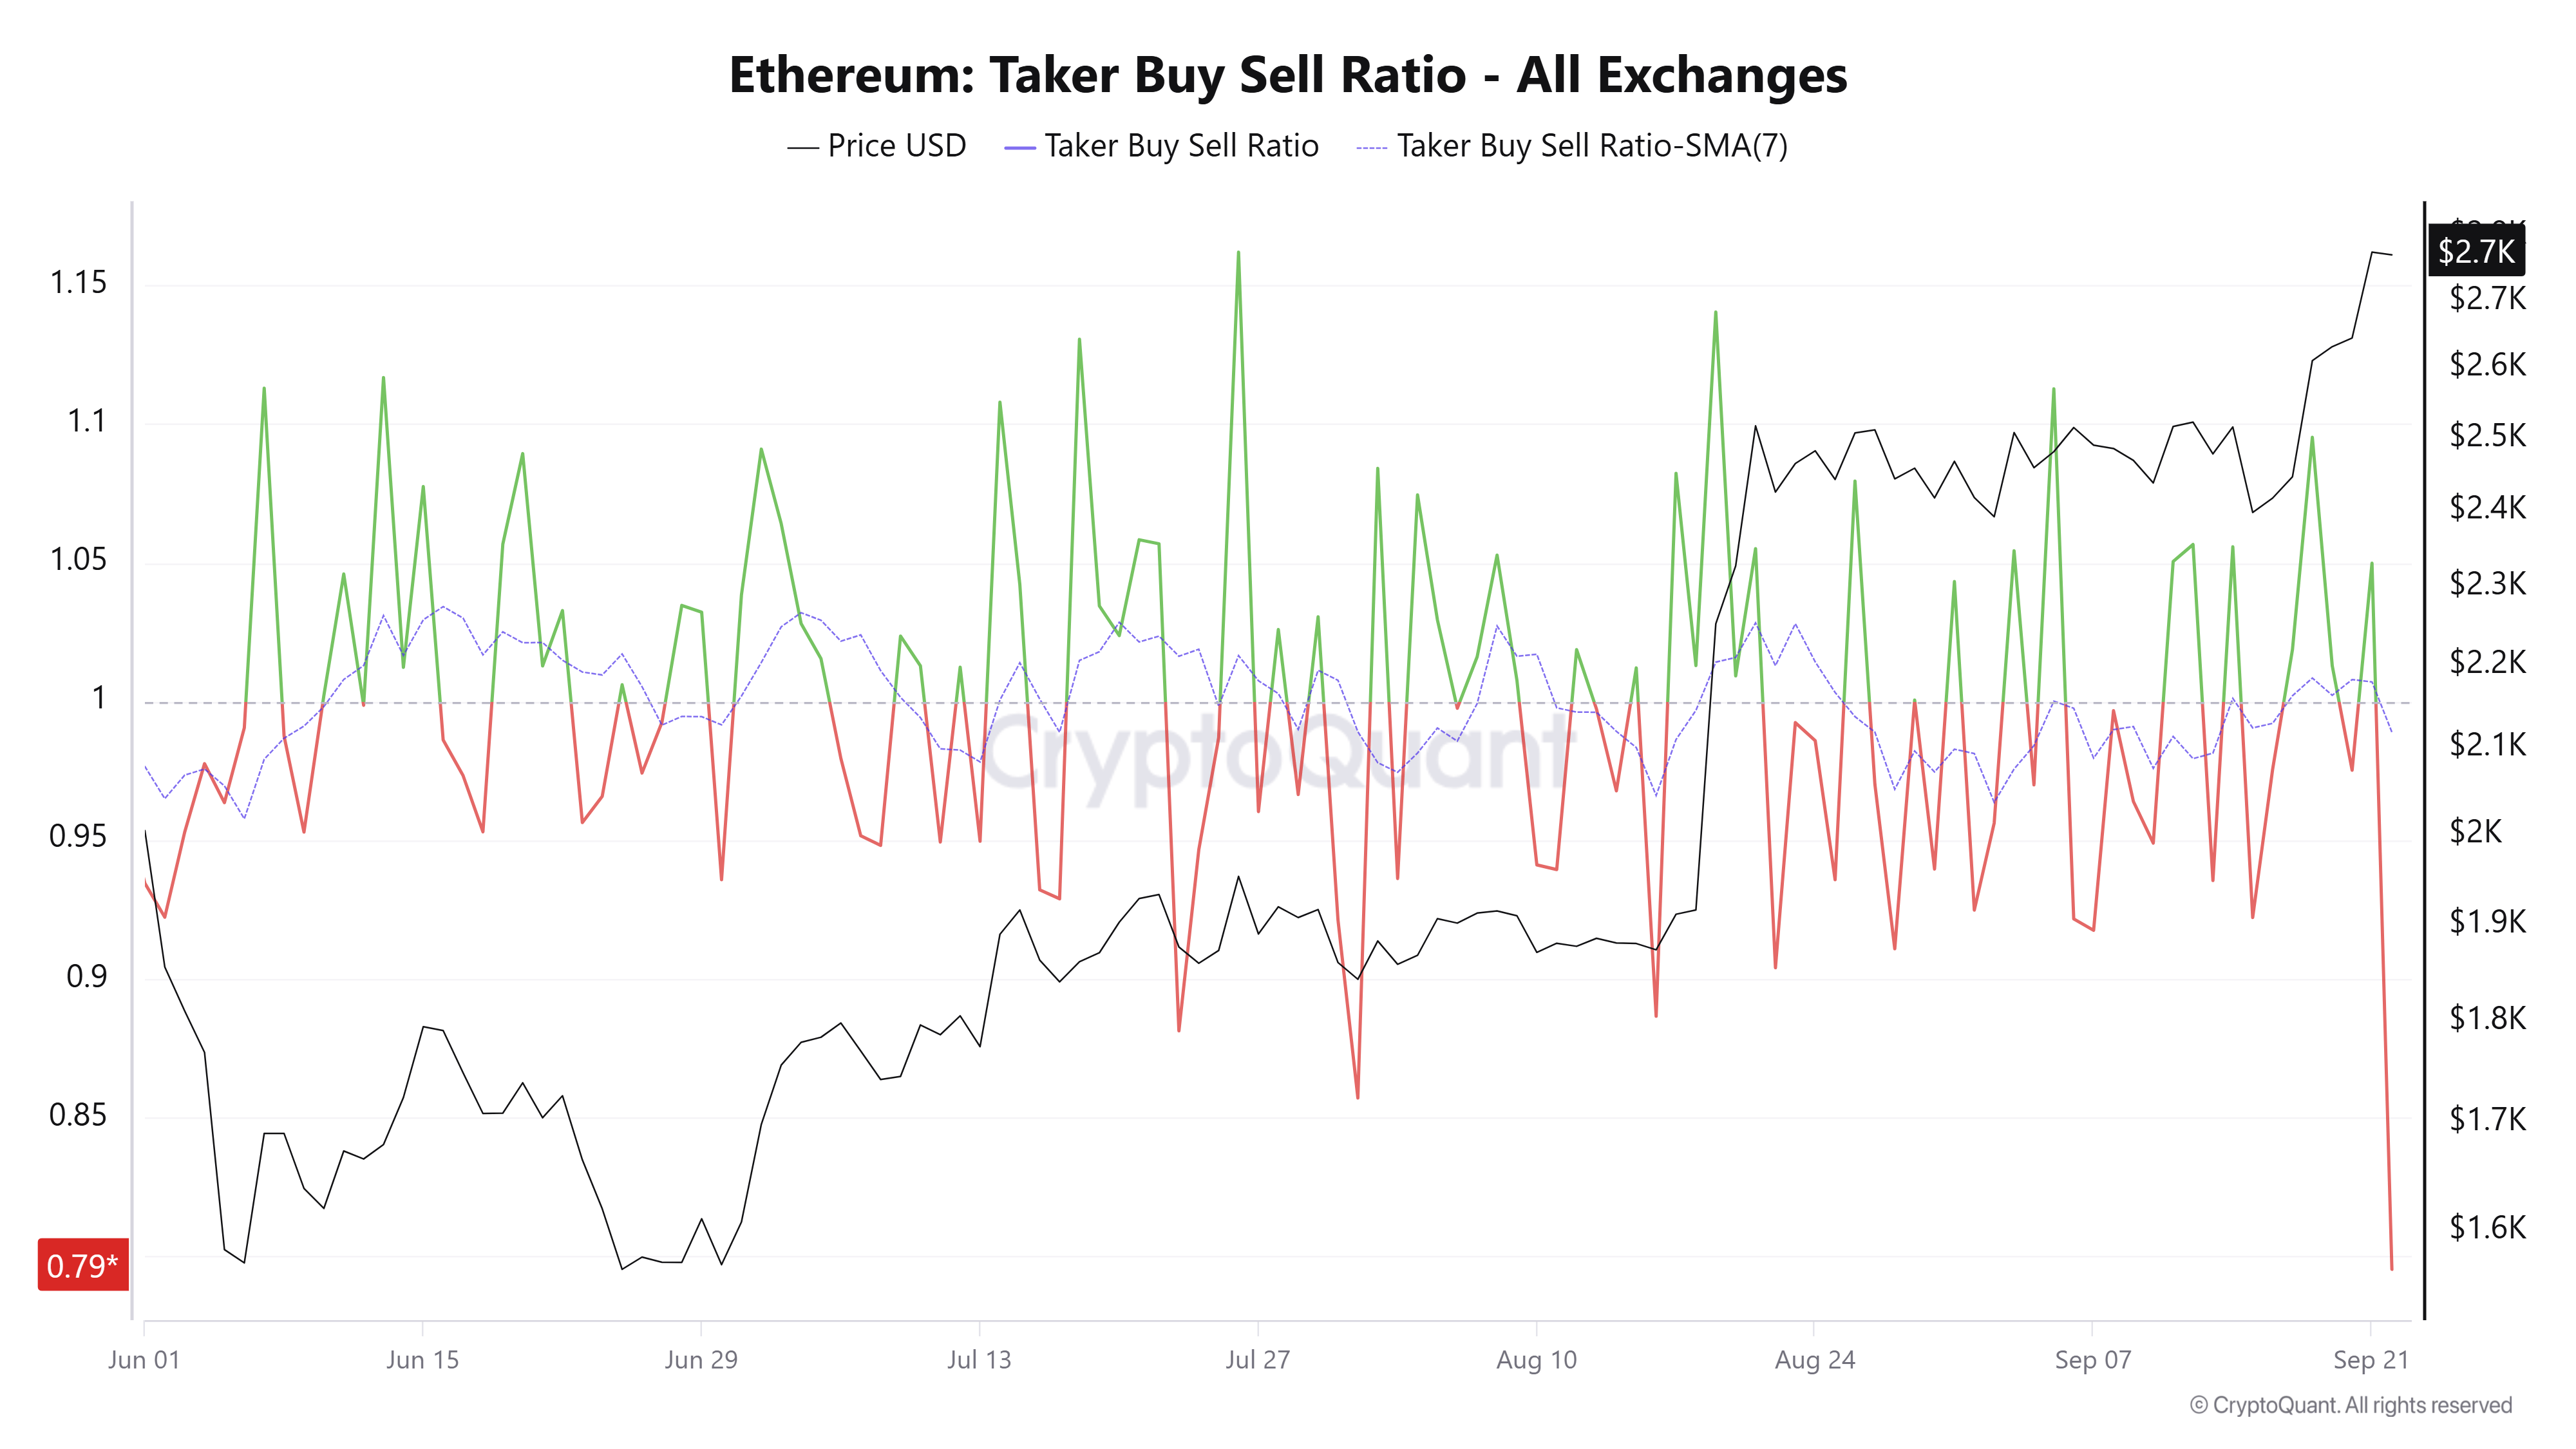
On the derivatives side, the Taker Buy Sell Ratio, which measures immediate market activity in ETH perpetuals, continued to trend upward over the weekend, with its 7-day moving average breaking into positive territory. But sentiment has flipped on Monday, with bearish positioning regaining dominance. The move indicates expectations of a decline after the recent rise.
Ethereum technical outlook: ETH faces $2,786 resistance
Ethereum saw $224.7 million in liquidations over the past 24 hours, led by $191 million in short liquidations, according to Coinglass data.
On the daily chart, ETH maintains a clear bullish bias as price holds well above the 20-, 50-, 100-, and 200-day Exponential Moving Averages (EMAs), with the 20-day EMA at $2,537 leading the short-term uptrend.
The 14-day Relative Strength Index (RSI) at 71 and the Stochastic Oscillator (Stoch) at 91 both sit in overbought territory, suggesting strong but potentially stretched upside momentum as price grinds toward nearby overhead levels.
On the topside, immediate resistance is located at the horizontal barrier at $2,786, which caps the latest advance for now before the $2,894 and $3,177 levels.
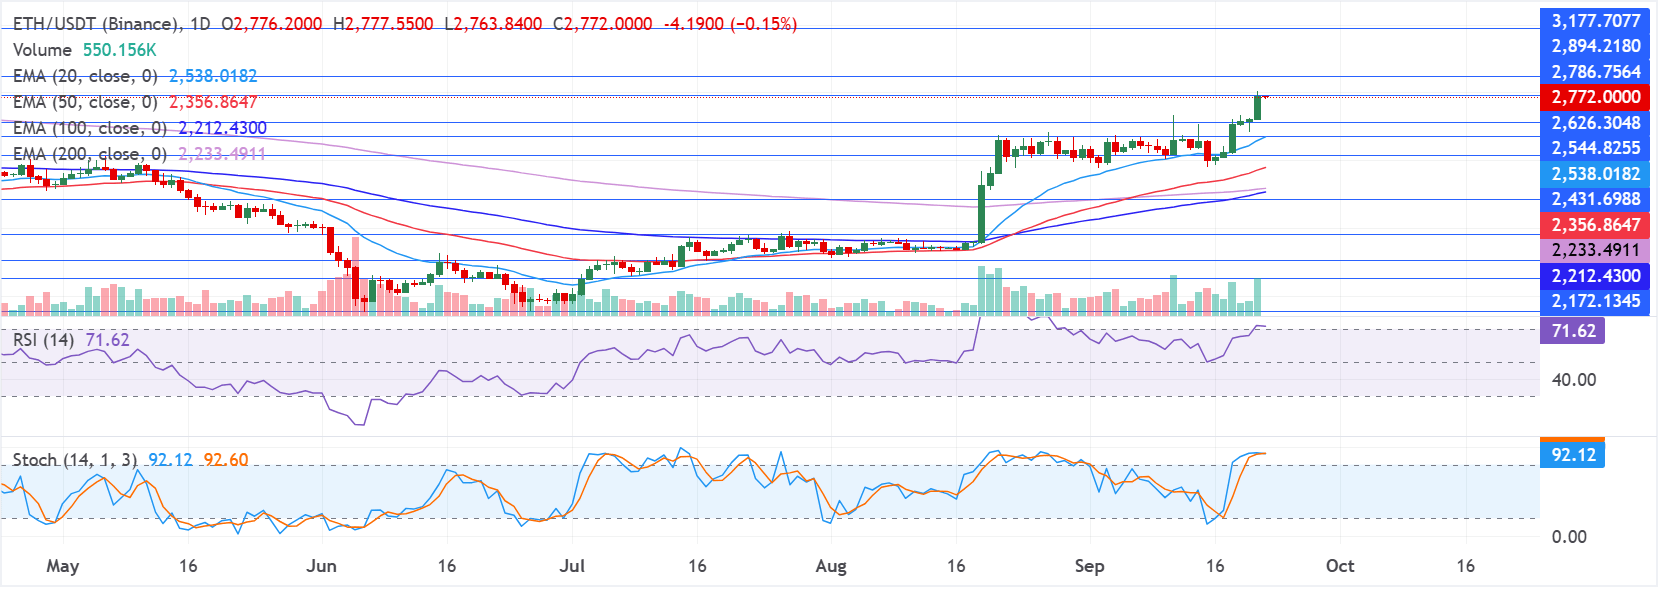
On the downside, initial support is seen at the recent structural floor around $2,626, followed by a dense demand zone formed by the $2,544 horizontal level and the 20-day EMA at $2,537. Below that, the $2,431 horizontal support aligns with the 50-day EMA at $2,356, while deeper pullbacks could target the 200- and 100-day EMA before the prior support band near $2,172.
(The technical analysis of this story was written with the help of an AI tool. Know more.)
Recommended Articles







Comments (0)
Click the $ button, enter the symbol, and select to link a stock, ETF, or other ticker.