


Cardano Price Forecast: ADA extends gains on bullish derivatives



- Cardano extends gains, trading above $0.210 on Friday after finding support around a key zone earlier this week.
- Derivatives metrics support a bullish outlook, with long positions reaching their highest level over a month alongside positive funding rates.
- The technical outlook shows a neutral-to-positive bias, with momentum indicators signaling fading bearish pressure.
Cardano (ADA) extends its recovery, trading above $0.210 at the time of writing on Friday, after finding support around a key zone earlier this week. Improving derivatives positioning and supporting technical indicators indicate growing bullish sentiment among ADA traders.
Derivatives data shows bullish bias
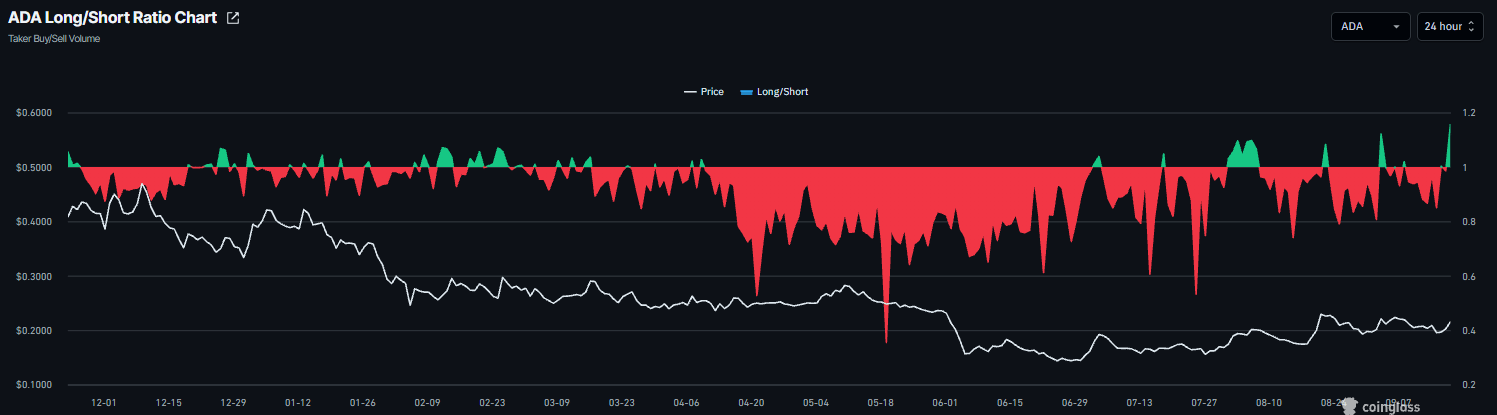
Derivatives data shows a bullish tilt among Cardano traders. CoinGlass’ long-to-short ratios for ADA read 1.15 on Friday, the highest level over a month. A ratio above one indicates bullish sentiment, as traders bet asset prices will rise.
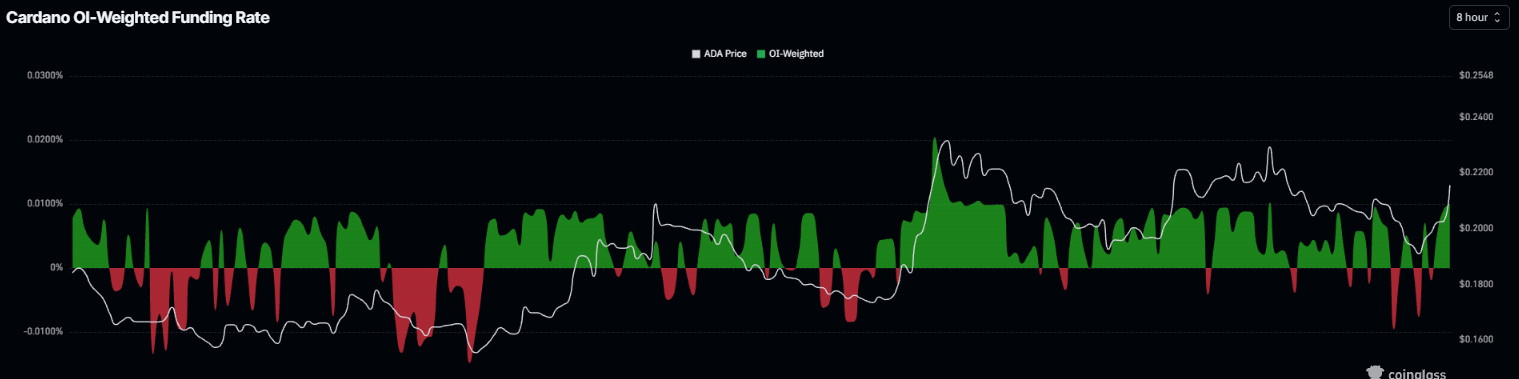
In addition, Cardano funding rates also support a bullish bias. ADA funding rate flipped positive on Thursday and read 0.010% on Friday. This positive rate indicates that longs are paying shorts and reflects a bullish outlook for ADA.
Cardano technical outlook: Fading bearish momentum
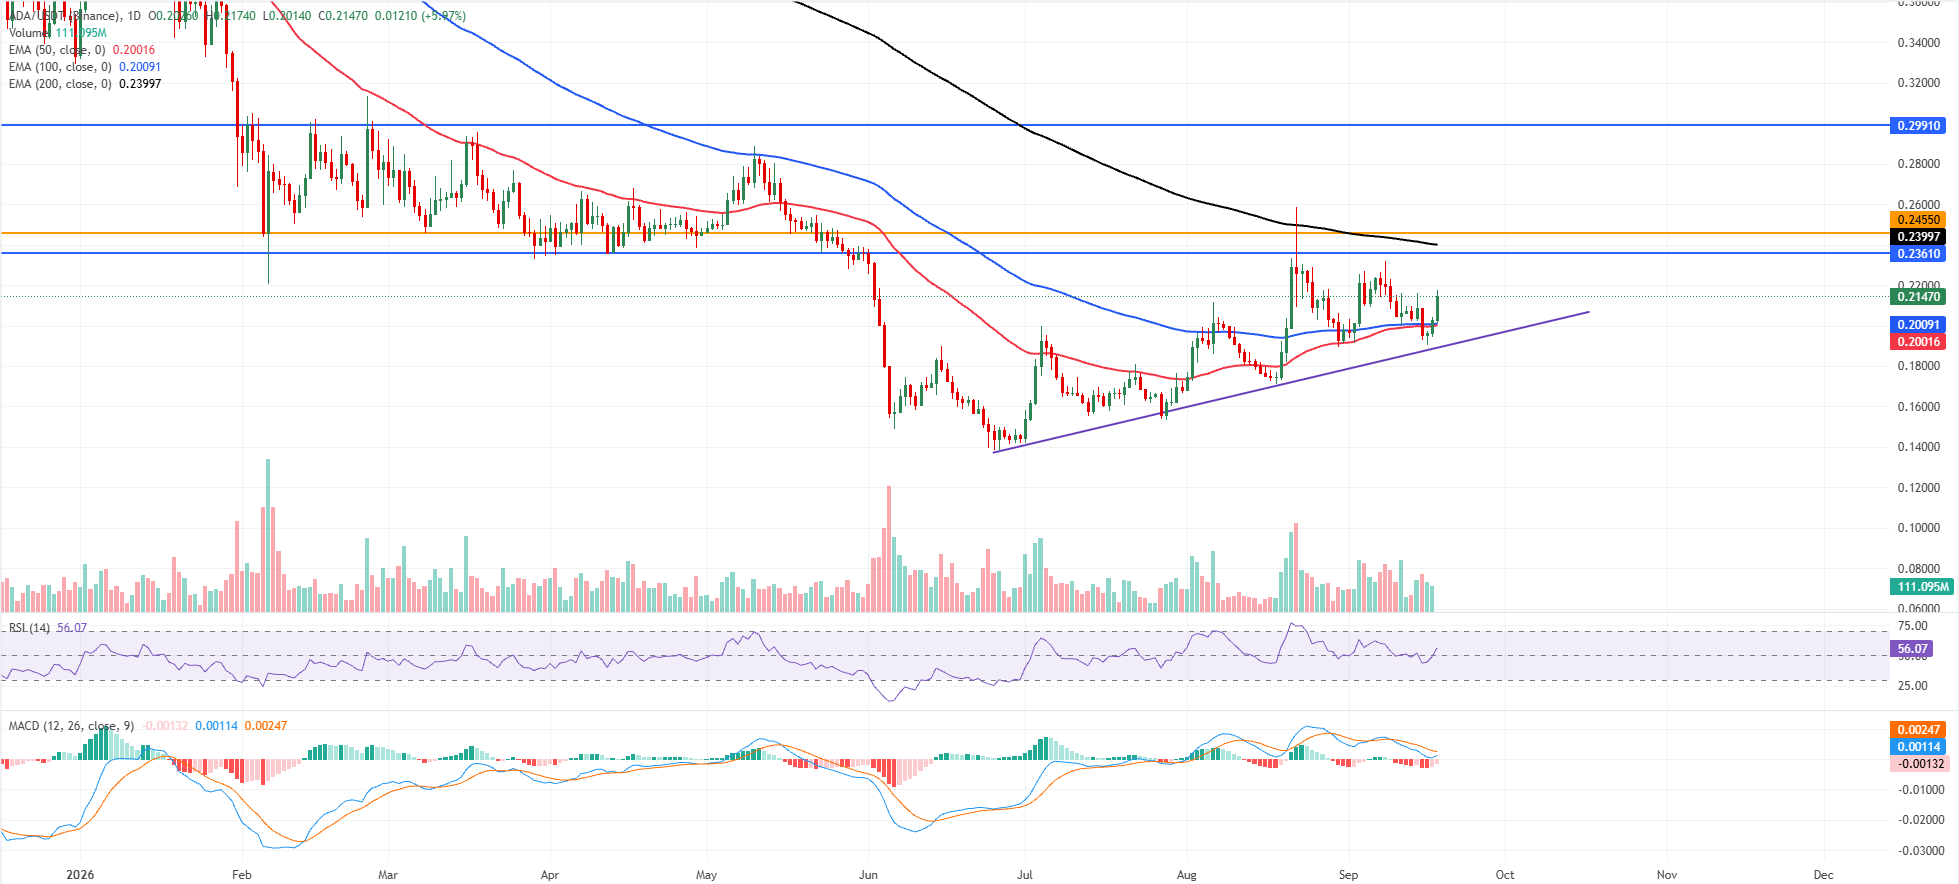
Cardano price trades at $0.214 on Friday after gaining over 3% in the previous two days. ADA holds a mildly constructive tone as it advances above the 50-day and 100-day Exponential Moving Averages (EMAs) around $0.200, yet remains capped by the 200-day EMA at $0.239, which maintains broader upside pressure in check.
The Relative Strength Index (RSI) at 56 reinforces a neutral-to-positive bias. At the same time, the Moving Average Convergence Divergence (MACD) indicator stays marginally below zero, hinting that bullish momentum is improving but not yet decisive against the overhead daily trend barrier.
On the topside, initial resistance sits at $0.236, followed closely by the 200-day EMA at $0.239 and then another supply zone at $0.245, forming a dense cap that bulls must clear to extend gains toward the higher resistance at $0.299.
On the downside, immediate support comes from the short-term EMAs clustered around $0.200, with the former trendline break area near $0.189 offering a deeper structural floor if corrective pressure emerges.
(The technical analysis of this story was written with the help of an AI tool. Know more.)
Recommended Articles









Comments (0)
Click the $ button, enter the symbol, and select to link a stock, ETF, or other ticker.