


Pi Network Price Forecast: PI stages mild August recovery amid potential DEX environment test



- Pi Network hovers around $0.0900, extending its consolidation below $0.1000 and posting a +9.23% gain so far in August.
- The release of around 30 new tokens on the Pi Testnet suggests a likely ongoing DEX environment test.
- The technical outlook for PI remains mixed, as the lack of decisive momentum prolongs the consolidation phase.
Pi Network (PI) is trading around $0.0900 on Monday, continuing its consolidation above the $0.0836 support floor. The PI Testnet has seen around 30 new tokens released under the names of leading corporations, suggesting a potential test of the DEX environment. The technical outlook for PI remains mixed, with momentum low amid firm headwinds.
Pi Network’s potential DEX test
A Pi Network developer and founder of PiSchool shared on X about the release of multiple tokens on the Pi Testnet. Around 30 unofficial tokens were released under the names of major global companies, Amazon, Microsoft, and Meta. The newly listed tokens are integrated with the Pi Wallet and can be connected to DEX interfaces for swaps, pointing to a potential environment test.

Technical outlook: Could Pi Network regain bullish momentum?
Pi Network trades at $0.0904 on Monday, sustaining a mixed near-term tone. The PI token prolongs a consolidative sideways trend below the $0.1000 psychological threshold.
The 23.6% Fibonacci retracement of the downswing from $0.1341 to $0.0703 at $0.0853 acts as the support level of the consolidation range. For a decisive upward trend, the PI token must print a decisive confirmed breakout of the 50% retracement at $0.1022, opening the door toward the 78.6% Fibonacci retracement at $0.1204.
Momentum is mixed on the daily chart, with the Moving Average Convergence Divergence (MACD) in slightly positive territory and the Relative Strength Index (RSI) hovering around the neutral 50 mark, which only hints at tentative stabilization.
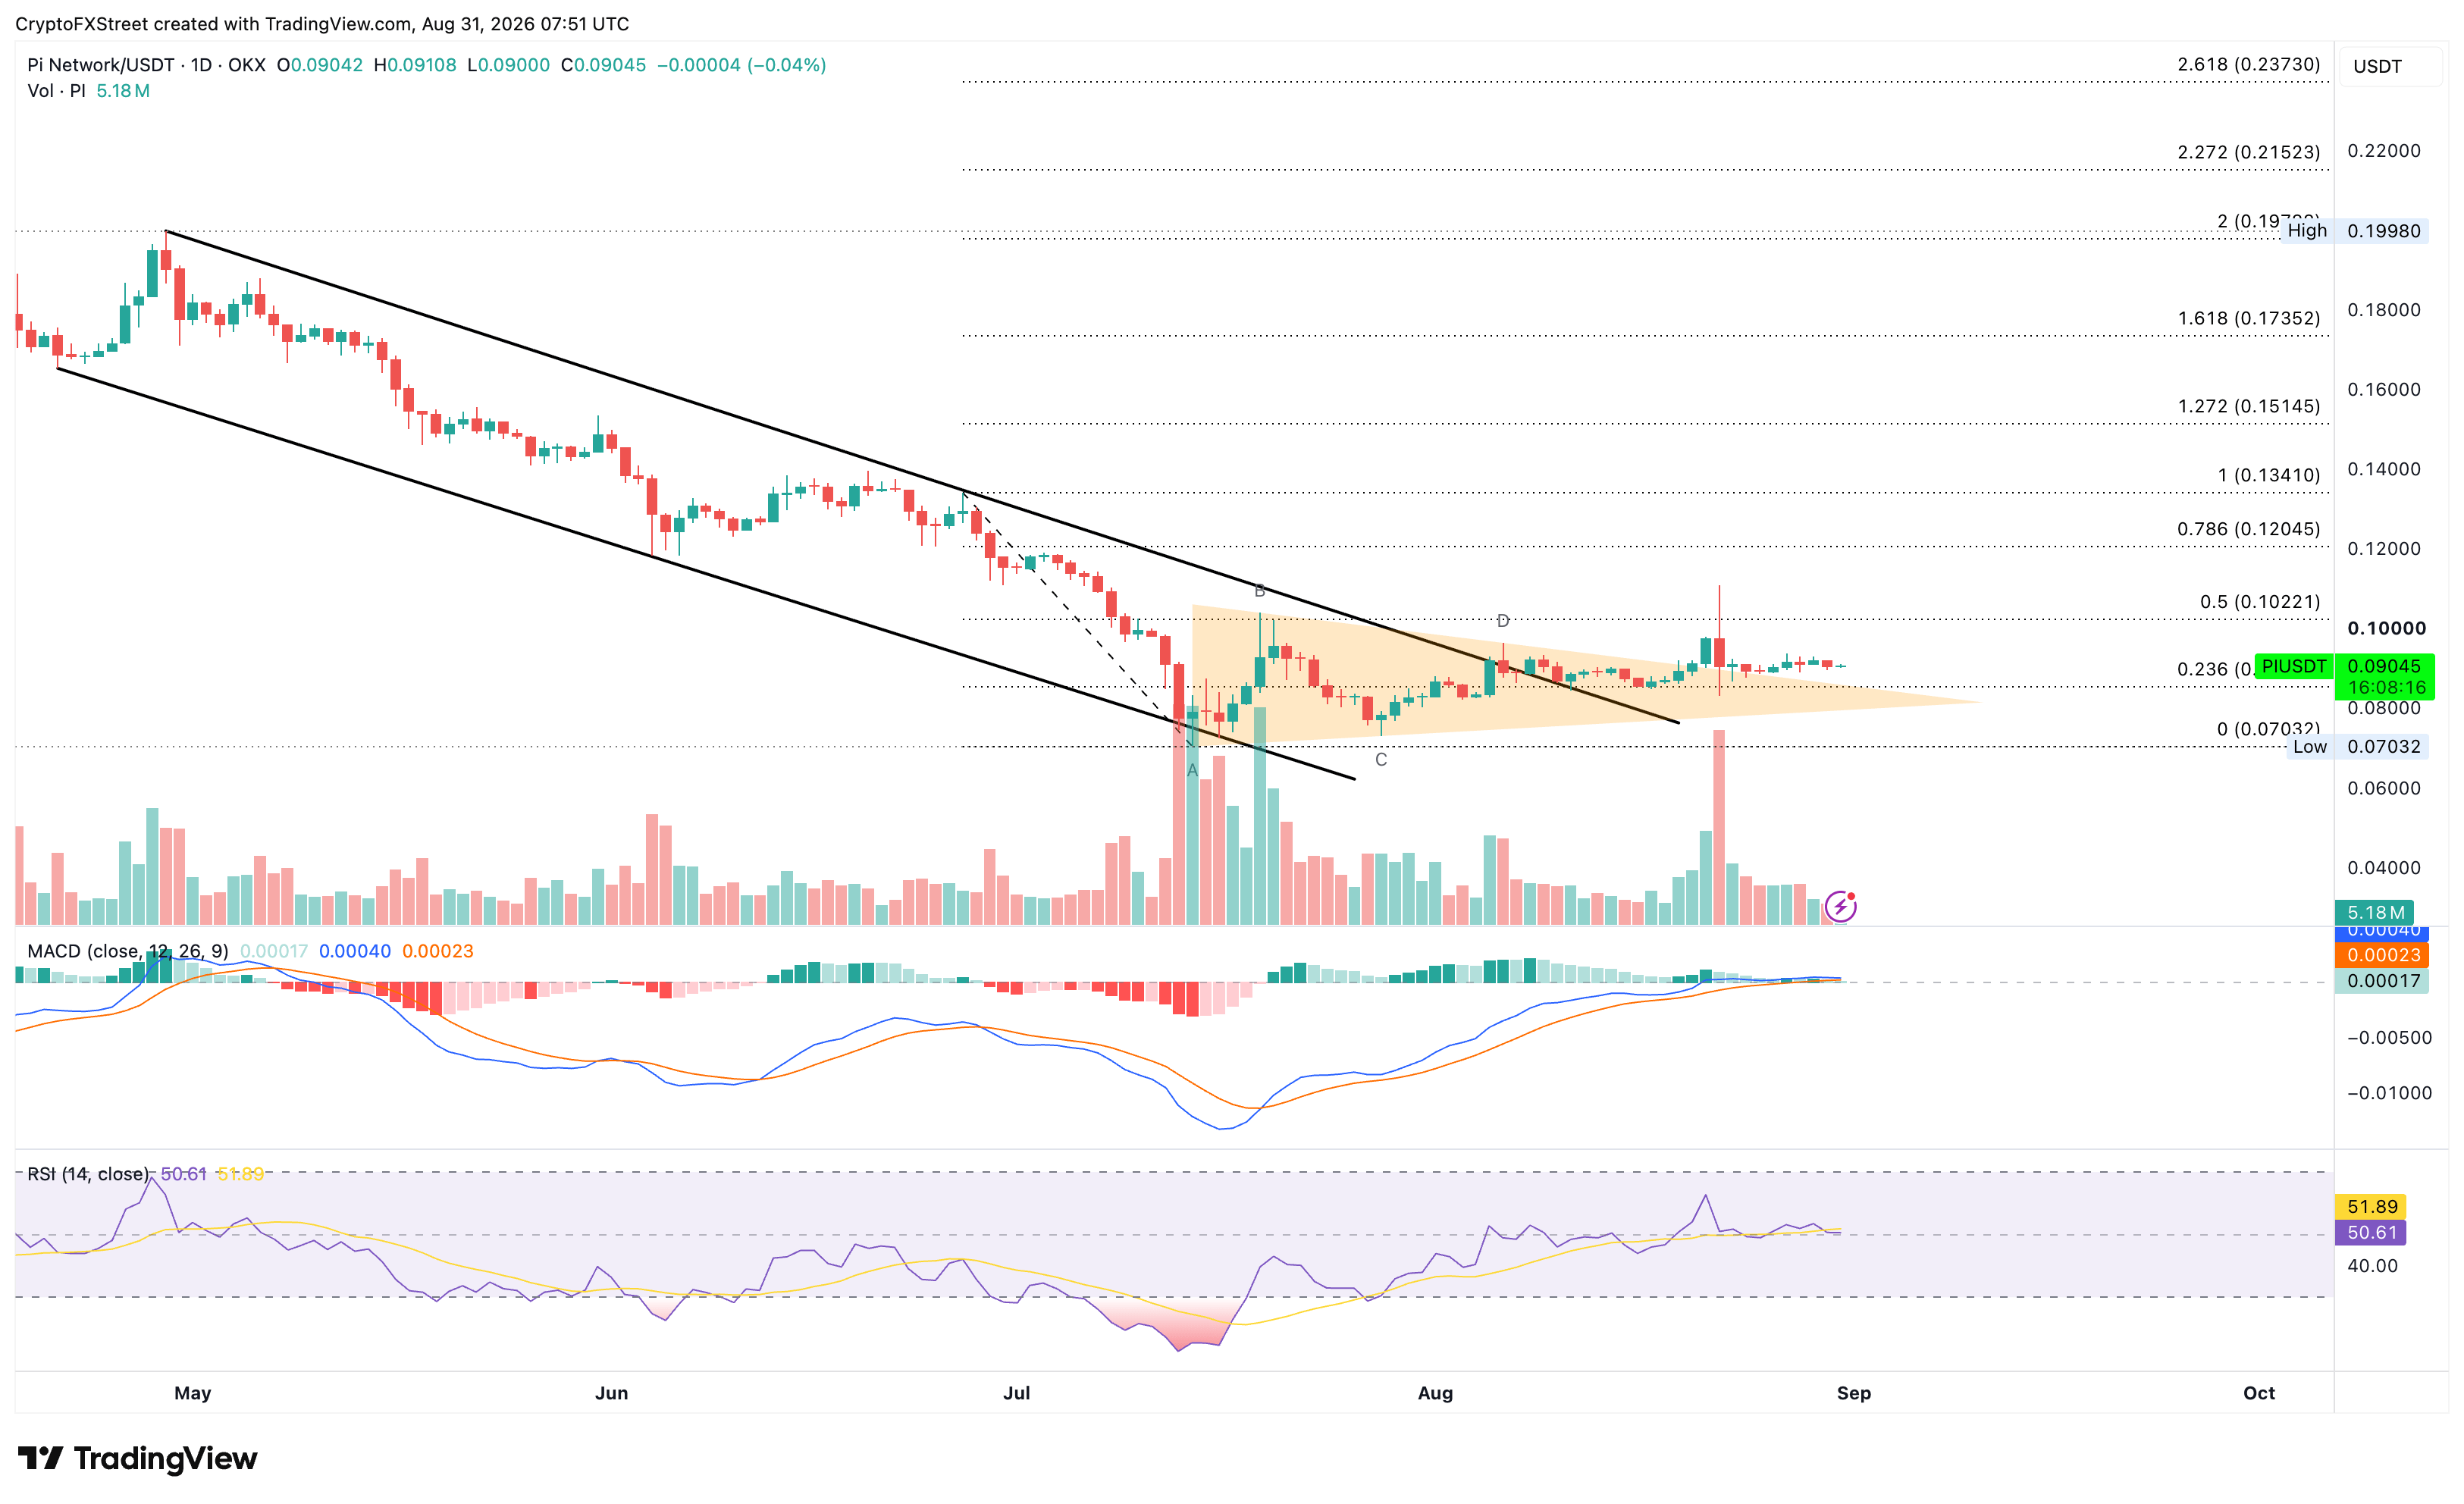
On the downside, a confirmed breakout below $0.0853 could extend the decline toward the Fibonacci anchor at $0.0703.
(The technical analysis of this story was written with the help of an AI tool. Know more.)
Recommended Articles








Comments (0)
Click the $ button, enter the symbol, and select to link a stock, ETF, or other ticker.