


XRP Reversal Setup Forms Around Harmonic Pattern And Key Support Zone



TL;DR
- A TradingView analyst says XRP is trading at a critical support zone.
- The setup includes 0.618 Fibonacci retracement and point-of-control confluence.
- The analyst is watching whether XRP can build the base for a larger harmonic reversal.
XRP is sitting at a technically important area that could shape its next larger move, according to a June 20 TradingView idea from The_Alchemist_Trader_. The analyst described XRPUSD as trading at a critical support zone backed by several layers of confluence, including the 0.618 Fibonacci retracement level and the point of control of the current trading range.
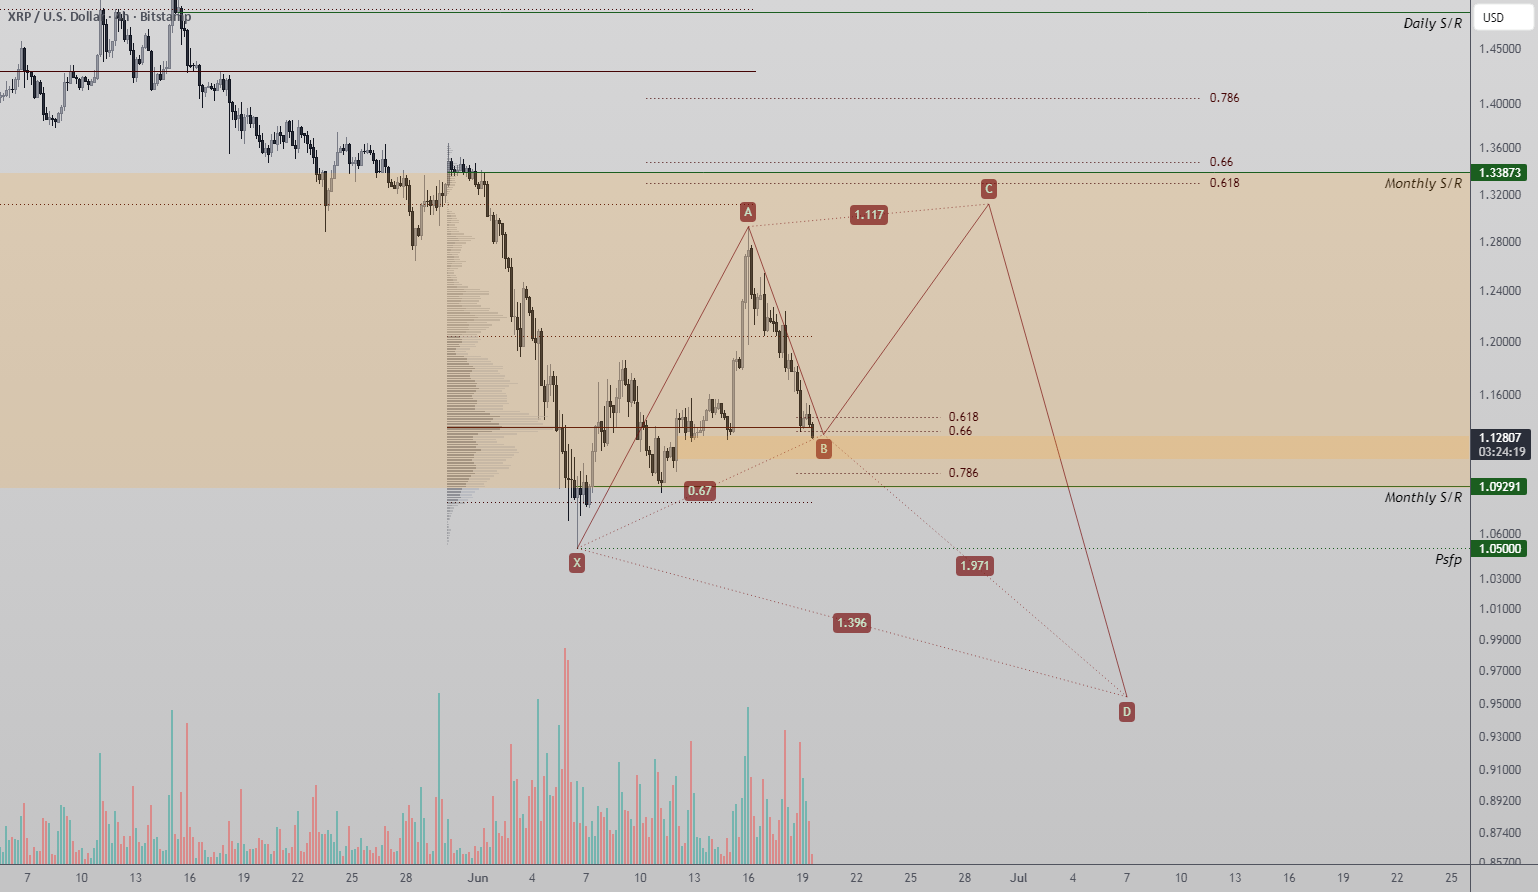
Confluence matters because traders often give more weight to zones where several methods point to the same area. A Fibonacci retracement can attract technical buyers on its own. A point of control can also act as a magnet because it represents a heavily traded price region. When both line up, the area can become a natural battleground between dip buyers and sellers.
Harmonic Reversal Thesis Builds
The chart thesis suggests XRP may be trying to build the foundation for a broader reversal pattern. Harmonic setups are not guarantees, but they are popular because they give traders a structured way to identify potential turning points, invalidation areas and measured targets.
For XRP, the key question is whether support produces a decisive reaction or simply slows the decline. A strong bounce from confluence would support the reversal argument. Weak demand, repeated tests and a loss of the support region would make the harmonic thesis harder to defend.
What XRP Traders Need To See
XRP bulls need follow-through, not just a reaction wick. That means reclaiming nearby resistance, sustaining volume and avoiding a quick return into the same support zone. Without that, the market may treat the setup as another failed bounce.
The analysis is best viewed as a setup rather than a prediction. The support zone is clear, the confluence is notable, and the potential reversal structure is worth watching. But the market still has to confirm it with price action.
This report is based on information from TradingView The_Alchemist_Trader_.
This article was written by the News Desk and edited by Samuel Rae.
Recommended Articles








Comments (0)
Click the $ button, enter the symbol, and select to link a stock, ETF, or other ticker.