


Ethereum Golden Triangle Survives As Structure Remains Unbroken, This Target Says $10,000 Is Coming



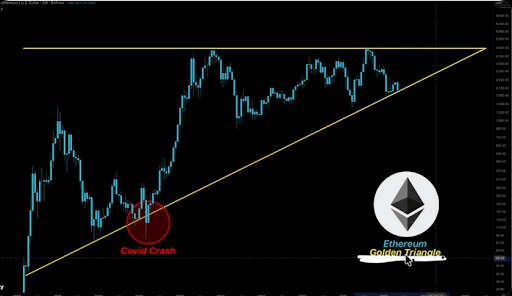
Technical analysis of the 3-week chart outlook shows ETH pressing into the apex of a golden triangle formation that has survived the Covid crash, the 2022 bear market, and the ongoing 2026 correction. According to the analyst who first identified it, what happens next at the apex of that structure may define Ethereum’s trajectory for the next several years.
Ethereum’s Nine-Year Structure
Ethereum’s 3-week candlestick chart highlights a long ascending support line beginning near the early market cycle lows and stretching through the 2020 Covid crash, the 2022 bear market, and the latest correction since its August 2025 all-time high of $4,946.
The formation’s upper boundary is a horizontal trendline, around the $4,800 to $4,900 range. Ethereum has struggled around that horizontal resistance, including during the 2021 peak and again during its return to record peaks. The lower boundary, however, has been the more important part of the structure because it has defined the larger bull-market trend for almost a decade.
Each major downturn has tested the trend, but the structure has not yet broken with a close below the support trendline with a 3-week candlestick. That is why the current position on the chart is more than another routine support test. According to a crypto analyst that goes by the name Crypto Tice on X, this is the moment of truth. The triangle has survived everything the market threw at it, but nothing it has faced compares to right now.
Where Ethereum Goes From The Golden Triangle
The Golden Triangle now leaves Ethereum with two scenarios. The first is the bullish path, which depends on ETH continuing to hold the long-term ascending support line. The important breakdown level is at $1,950, meaning Ethereum still has to close the current 3-week candlestick above this level to keep the nine-year structure alive.
A successful hold above $1,950 would keep Ethereum inside the triangle and give bulls a chance to push the price back into the upper range of the structure. From there, the next important price level to watch is $4,350. That would turn the defensive setup into a breakout structure, with analyst Crypto Tice’s projected target at $10,000.
The second scenario is the bearish one. A break and multiple candlestick closes below $1,950 would carry far more weight than a normal pullback because it would push Ethereum beneath the rising support that has guided the market through the Covid crash and the 2022 bear market. Such a move would cancel out the golden triangle thesis and imply that the nine-year bullish structure has finally failed.
At the time of writing, Ethereum is trading at $1,575, down by 6% and 22% in the past 24 hours and seven days, respectively. However, there’s still time for Ethereum to return above $1,950 before the end of June.
Recommended Articles







Comments (0)
Click the $ button, enter the symbol, and select to link a stock, ETF, or other ticker.