


Bitcoin Forms The Same Pattern That Previously Led To A 400% Rally



A chart shared on May 7, 2026, by analyst @CryptoTice highlights a technical formation that mirrors the setup seen ahead of Bitcoin’s surge from roughly $17,000 to $69,000. According to the analysis, the same structural signals have appeared again on the long-term chart, raising expectations that the market could be preparing for another major rally.
Bitcoin Rally Structure: ATH Break Then Retest
The 2020 market cycle began when Bitcoin finally moved above its previous ATH after spending a long period trading sideways in an accumulation phase. However, the move did not immediately turn into a sustained rally. Instead, Bitcoin paused and began trading within a horizontal range close to the breakout level, forming a consolidation zone where significant trading activity took place.
The chart shared by analyst CryptoTice shows that Bitcoin is forming a very similar structure in the current cycle. Just as in the earlier period, Bitcoin has already pushed beyond a previous ATH before settling into a comparable horizontal range.
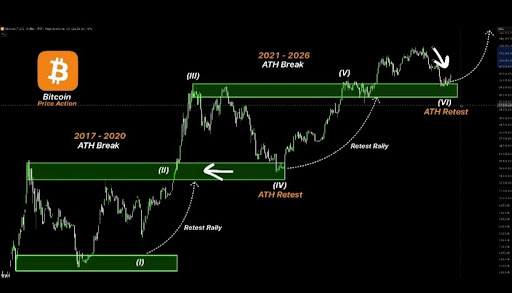
In both cycles, the breakout was followed by a period when the price slowed, and Bitcoin traded around the former resistance area. Instead of breaking down further, Bitcoin found support there and began stabilizing. This movement confirmed that the level that once acted as resistance had now turned into support, resulting in a retest of the former all-time high zone.
The current chart indicates that the same retest pattern may be developing again. After reaching a new peak, Bitcoin has started moving back toward the breakout area once more. According to the analyst, this pullback represents the current retest phase of the cycle, closely matching the stage that appeared just before Bitcoin’s previous 400% rally.
Bitcoin Rally Comparison: From Retest To Expansion
After the retest held during the previous cycle, Bitcoin began moving upward again. Momentum gradually built until the market entered a strong expansion phase, eventually pushing Bitcoin from about $17,000 to $69,000.
The chart indicates the current market may be approaching the same stage. In the earlier cycle, the rally began after Bitcoin successfully held the retest level. The present structure appears similar, with the green band on the chart marking the key support area analysts are monitoring to see if the pattern remains intact.
Current market data provides additional context. Bitcoin is trading near $80,667, with a market capitalization of about $1.61 trillion and a circulating supply close to 20 million BTC. Although the market is significantly larger than it was during the previous cycle, the long-term price structure still resembles the earlier formation.
The analyst’s chart also includes a projected path reflecting the same sequence seen before: a breakout above the previous high, a retest of that level, and then a sustained rally. Overall, the chart suggests Bitcoin may be repeating the structure that previously led to a 400% rally, with the ongoing retest potentially serving as the launch point for the next major leg up.
Recommended Articles







Comments (0)
Click the $ button, enter the symbol, and select to link a stock, ETF, or other ticker.