


Solana (SOL) Edges Up, Traders Watch For Sustained Upside Move



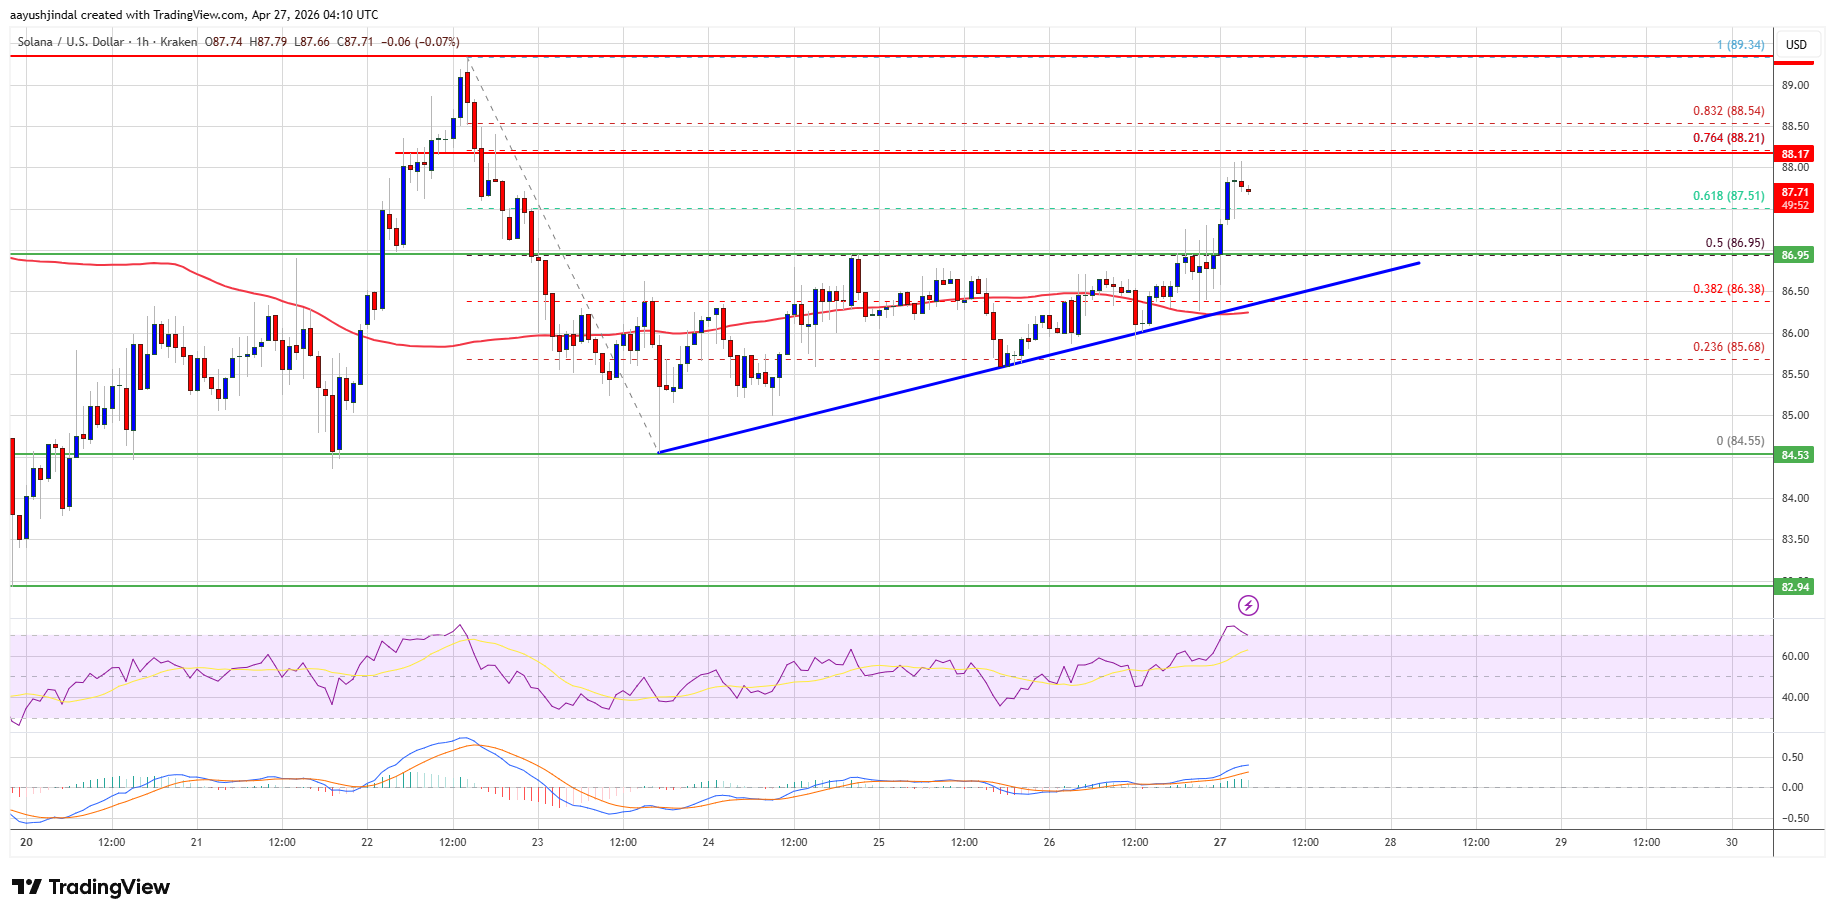
Solana started a fresh increase above the $86 zone. SOL price is now consolidating above $87 and might aim for more gains above the $90 zone.
- SOL price started a fresh upward move above the $85 and $86 levels against the US Dollar.
- The price is now trading above $87 and the 100-hourly simple moving average.
- There is a bullish trend line forming with support at $86.50 on the hourly chart of the SOL/USD pair (data source from Kraken).
- The pair could extend gains if it clears the $90 resistance zone.
Solana Price Regains Traction
Solana price corrected gains from the $90 zone but remained stable above the $85 zone, like Bitcoin and Ethereum. SOL formed a low near $85 and started a fresh upward move.
The price climbed above the $85 level to enter a short-term positive zone. It surpassed the 50% Fib retracement level of the downward move from the $89.34 swing high to the $84.55 low. Besides, there is a bullish trend line forming with support at $86.50 on the hourly chart of the SOL/USD pair.
Solana is now trading above $87 and the 100-hourly simple moving average. On the upside, the price is facing resistance near $88.20 and the 76.4% Fib retracement level of the downward move from the $89.34 swing high to the $84.55 low. The next major resistance is near the $90 level.
The main resistance could be $92. A successful close above the $92 resistance zone could set the pace for another steady increase. The next key resistance is $100. Any more gains might send the price toward the $105 level.
Another Decline In SOL?
If SOL fails to rise above the $90 resistance, it could start another decline. Initial support on the downside is near the $86.50 zone and the trend line. The first major support is near the $85 level.
A break below the $85 level might send the price toward the $80 support zone. If there is a close below the $78 support, the price could decline toward the $72 support in the near term.
Technical Indicators
Hourly MACD – The MACD for SOL/USD is gaining pace in the bullish zone.
Hourly Hours RSI (Relative Strength Index) – The RSI for SOL/USD is above the 50 level.
Major Support Levels – $86.50 and $85.00.
Major Resistance Levels – $88.20 and $90.00.
Recommended Articles








Comments (0)
Click the $ button, enter the symbol, and select to link a stock, ETF, or other ticker.