


Ethereum Sees First SuperTrend Bullish Flip In Over A Year



A cryptocurrency analyst has highlighted how the SuperTrend for the daily Ethereum price has seen its first bullish flip in over a year.
Ethereum SuperTrend Is Now Giving A Buy Signal
In a new post on X, analyst Ali Martinez has discussed the latest development in the SuperTrend of Ethereum. The “SuperTrend” here refers to an indicator that tells us whether an asset is following a bullish or bearish trajectory right now. It’s based on another indicator known as the Average True Range (ATR), which measures the volatility of the cryptocurrency’s price.
The SuperTrend involves only one trendline, which takes turns acting as resistance and support, depending on which side of it the asset is trading. The price moving under or above this line can indicate a flip of trend in the market.
Now, here is the chart shared by Martinez that shows how the SuperTrend has looked for the 1-day Ethereum price over the past year and a half:

As displayed in the above graph, the 1-day Ethereum price was trading under the SuperTrend line since Q4 2025, but the latest market recovery has meant that the trend has finally flipped for the cryptocurrency ranked second by market cap.
The shift toward a bullish trend in the indicator has arrived for the first time since the first half of 2025. Back then, the flip led into a bull rally. Given that the signal has once again arrived for ETH, it now remains to be seen whether it will hold for the asset this time as well or if it will turn out to be a temporary deviation.
While the SuperTrend has flipped for Ethereum, Bitcoin hasn’t been so lucky. As the analyst has pointed out in another X post, Bitcoin is yet to see its daily price break the SuperTrend resistance line. As such, at least from the perspective of the indicator, the Bitcoin recovery surge hasn’t been of a scale large enough to flip the trend.

In some other news, the US Ethereum spot exchange-traded funds (ETFs) have been enjoying net inflows recently, according to data from SoSoValue.
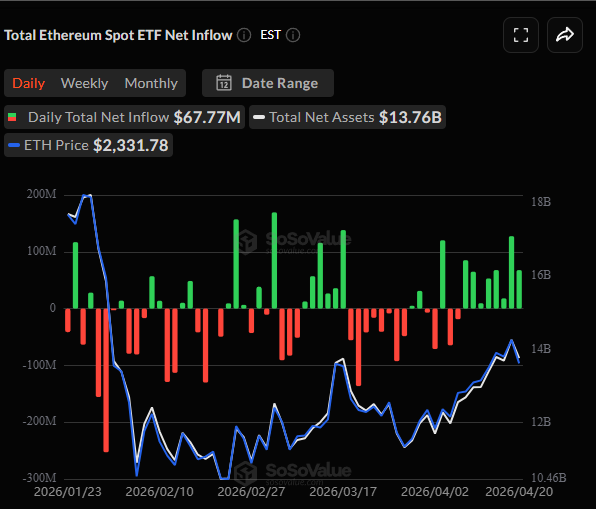
From the chart, it’s visible that the Ethereum spot ETF netflow has been green for eight consecutive days now, indicating that demand has consistently been flowing into the market via these investment vehicles.
ETH Price
At the time of writing, Ethereum is trading around $2,300, down over 3% in the past week.
Recommended Articles










Comments (0)
Click the $ button, enter the symbol, and select to link a stock, ETF, or other ticker.