


Why The PEPE Price Could Stage A 55X Rally To Reach New $0.0001 ATH



The PEPE price has now started to edge back into bullish conversations after the recent inflows into the crypto market. The last time PEPE’s weekly chart printed the kind of structure now forming on its chart, its price action delivered one of the most violent vertical rallies in crypto history. That was in 2023. Crypto analyst Crypto Patel is now arguing, with charts in hand, that the fractal-level structure has reloaded and that this cycle’s rally could be even bigger.
A PEPE Fractal Built On Rare Confluence
At the time of writing, PEPE is trading around $0.0000038, which leaves it about 87% below its all-time high of $0.00002803, yet still large enough to carry a market capitalization of $1.59 billion. However, technical analysis shows that this decline might end soon, and a 55x rally is possible for XRP.
The backbone of this prediction is the convergence of three technical structures on the weekly timeframe at the same price level: a Fair Value Gap, an Order Block, and a horizontal support zone that has been holding for the past few months. This kind of triple confluence at a single demand area is unusual at any timeframe, and on the weekly chart, it carries the weight of months of price history.
Back in 2023, PEPE entered an almost identical FVG-plus-Order-Block confluence after a prolonged breakdown and retest sequence, then launched into a 4,515% move. Crypto Patel’s projection maps the current structure as a direct mirror of that setup with the same breakdown, the same retest, and the same demand reclaim and assigns a 5,592% expansion target for this cycle.
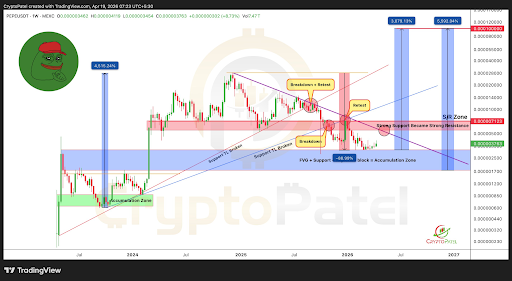
PEPE Price Chart. Source: @CryptoPatel On X
The intermediate targets along the way are at its current peak of $0.000028 and then $0.00005, which are consistent with the Fibonacci extensions typically seen in memecoin cycle expansions. The final target is a possible move to $0.0001 sometime during the end of the bull cycle, which would be a new all-time high by a substantial margin.
What Needs To Happen For A PEPE Rally?
PEPE is currently trading at $0.0000038, positioned right above an Accumulation Zone between the $0.0000030 and $0.0000018 demand blocks. The first major ceiling that PEPE must reclaim is an S/R flip zone around $0.0000071. This was a strong support level that flipped into resistance following a breakdown in Q3 2026.
A close and hold above $0.000006, according to the analyst, would be the structural confirmation that the super bullish expansion has begun. Interestingly, the analyst highlighted $0.0000017 as the invalidation level, which means the bullish idea only stays alive if the lower end of that weekly support continues to hold.
Recent market commentary has also pointed to improving short-term behavior for PEPE, with one analysis pointing out different bullish developments that point to a brewing rally.
Recommended Articles










Comments (0)
Click the $ button, enter the symbol, and select to link a stock, ETF, or other ticker.