


Ethereum Signals Major Reversal – $2,900 Target Back In Focus



Ethereum is starting to exhibit signs of a significant trend reversal as bullish momentum builds and key resistance levels give way. With market structure improving and confidence returning, the $2,900 target is once again coming into focus as the next potential milestone for price expansion.
Ascending Triangle Breakout Signals Bullish Continuation
Analyst Ali Charts recently observed that Ethereum has reached a pivotal turning point by officially clearing the horizontal X-axis of its long-standing ascending triangle pattern. This move was characterized by a decisive breakthrough of the $2,385 resistance level, representing more than just a price increase. It is also a fundamental structural shift that moves Ethereum out of a consolidation phase and into a confirmed expansionary period.
By successfully flipping the $2,385 mark into a foundational support floor, Ethereum has effectively neutralized recent bearish sell signals. With the flip complete, the previous overhead supply has been absorbed, leaving the market with significantly less friction for further upward movement. Meanwhile, the primary technical objective for this specific formation is now set at $2,900.
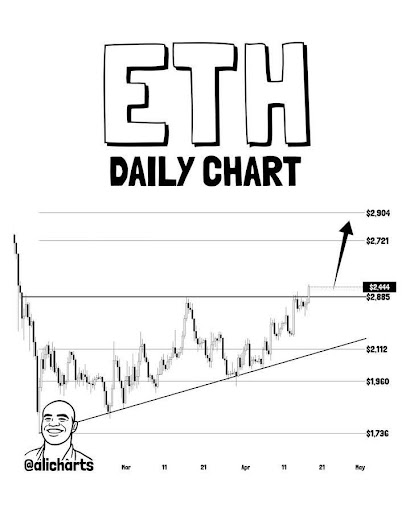
This target is derived from the measured move of the ascending triangle, suggesting a clear path ahead now that the breakout zone has been established. As long as Ethereum maintains its position above the critical $2,385 support level, the momentum remains firmly in the hands of the bulls, setting the stage for a steady rally toward the high-$2,900 range.
Bitcoin Top Vs Ethereum Bottom Narrative Grows Stronger
MarketMaestro recently reaffirmed the thesis of a Bitcoin top coinciding with an Ethereum bottom. This transition is appearing as an inverse Head and Shoulders pattern developing within a large triangle reaccumulation zone. The price is currently navigating the second region of the head structure, signaling a critical floor-setting phase for the asset.
A significant positive divergence has formed on the RSI, providing a highly bullish signal for momentum. This indicator strengthens the conviction that the $1,876 level served as the definitive price floor for this cycle. With the RSI and price action now in alignment, the bottoming process is considered almost fully confirmed by technical standards.
Furthermore, the outlook for the summer months remains very optimistic, suggesting a period of sustained positive performance. Investors should watch for the formation of the right shoulder on the chart, as this likely represents the final entry opportunity.
Once the current triangle reaccumulation pattern finally breaks, the market will enter a brand-new phase of price action. MarketMaestro expects the narrative to shift toward a much stronger and more aggressive rally scenario, possibly leading to the end of the bottoming phase and the beginning of a new market trend.
Recommended Articles










Comments (0)
Click the $ button, enter the symbol, and select to link a stock, ETF, or other ticker.