


Dogecoin’s Capital Flow: What 24-Hour Spot Flow Data Reveals About Its Next Move



Dogecoin’s price action is still stuck below $0.1, trading in a range so tight. Dogecoin’s price trajectory has spent the better part of April refusing to commit to a direction, and this trend is also reflected in its spot flow activity. The latest data from CoinGlass shows a split between short-term outflows and inflows on higher timeframes.
Dogecoin Buyers Are Showing Up, Just Not Enough
The latest Dogecoin spot flow data presents a balanced view of market activity. At first glance, Dogecoin’s spot flow data appears constructive, with inflows exceeding outflows across most timeframes. The 15-minute, 30-minute, 4-hour, 8-hour, 12-hour, and even 24-hour windows all show positive net inflows, suggesting that more capital is now entering into Dogecoin compared to those exiting.
However, a closer look tells a more cautious story. Despite the broadly positive readings, the actual net inflow values remain relatively small compared to the total volume. For instance, the 24-hour inflow of $96.73 million is only marginally higher than the $91.90 million in outflows, resulting in a net inflow of just $4.83 million.
A similar pattern is visible across other timeframes, where inflows are only slightly outpacing outflows. The 8-hour reading shows net inflows of $2.72 million, while the 12-hour window shows net inflows of only $716,000.
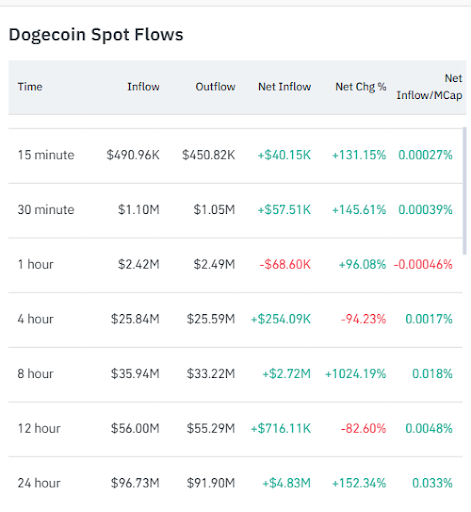
The imbalance is tilting positive, but there is a lack of strong conviction. Buyers are present, but they are not overwhelming sellers. Instead, it shows that Dogecoin is currently in a tightly contested market where capital is flowing in but not with enough force to establish clear upward momentum, which has kept the Dogecoin price below $0.1.
This is the kind of environment where price action is most likely to stay range-bound or compress further in the near future, as neither side is able to assert control.
Compression And A Breakout In Waiting?
Dogecoin’s price structure on the 12-hour chart is in a compression phase, where its price action is bouncing below a descending trendline of lower highs. A recent attempt to break above this resistance briefly pushed the price higher, but the move quickly failed, resulting in a rejection that sent the Dogecoin back into the body of the triangle.
Moves like this often act as a reset, clearing out early buyers and shifting focus back to the lower boundary of the pattern. According to technical analysis done by crypto analyst Ali Martinez, there is a high chance that the Dogecoin price will fall to test the support line at $0.088.
If buyers step in and defend $0.088, then Dogecoin could stabilize and make another attempt at breaking the descending trendline. However, a clean breakdown below this support would invalidate the structure, and the bears will most likely take control.
Recommended Articles










Comments (0)
Click the $ button, enter the symbol, and select to link a stock, ETF, or other ticker.