


Crypto Overview: Bitcoin steadies amid US-Iran ceasefire talks while RaveDAO and DeXe rally



- Bitcoin hovers above $74,000 on Wednesday, holding steady after Monday's 5% rise.
- Ceasefire negotiations between the US and Iran extend, lifting downside pressure on the cryptocurrency market.
- RaveDAO and DeXe extend gains over the last 24 hours, emerging as top performers.
The broader cryptocurrency market steadies, with Bitcoin (BTC) holding above $74,000 at press time on Wednesday amid US-Iran ceasefire talks and the dual blockade of the Strait of Hormuz. Meanwhile, RaveDAO (RAVE) and DeXe (DEXE) emerge as top performers over the last 24 hours.
Bitcoin steadies amid intense liquidations
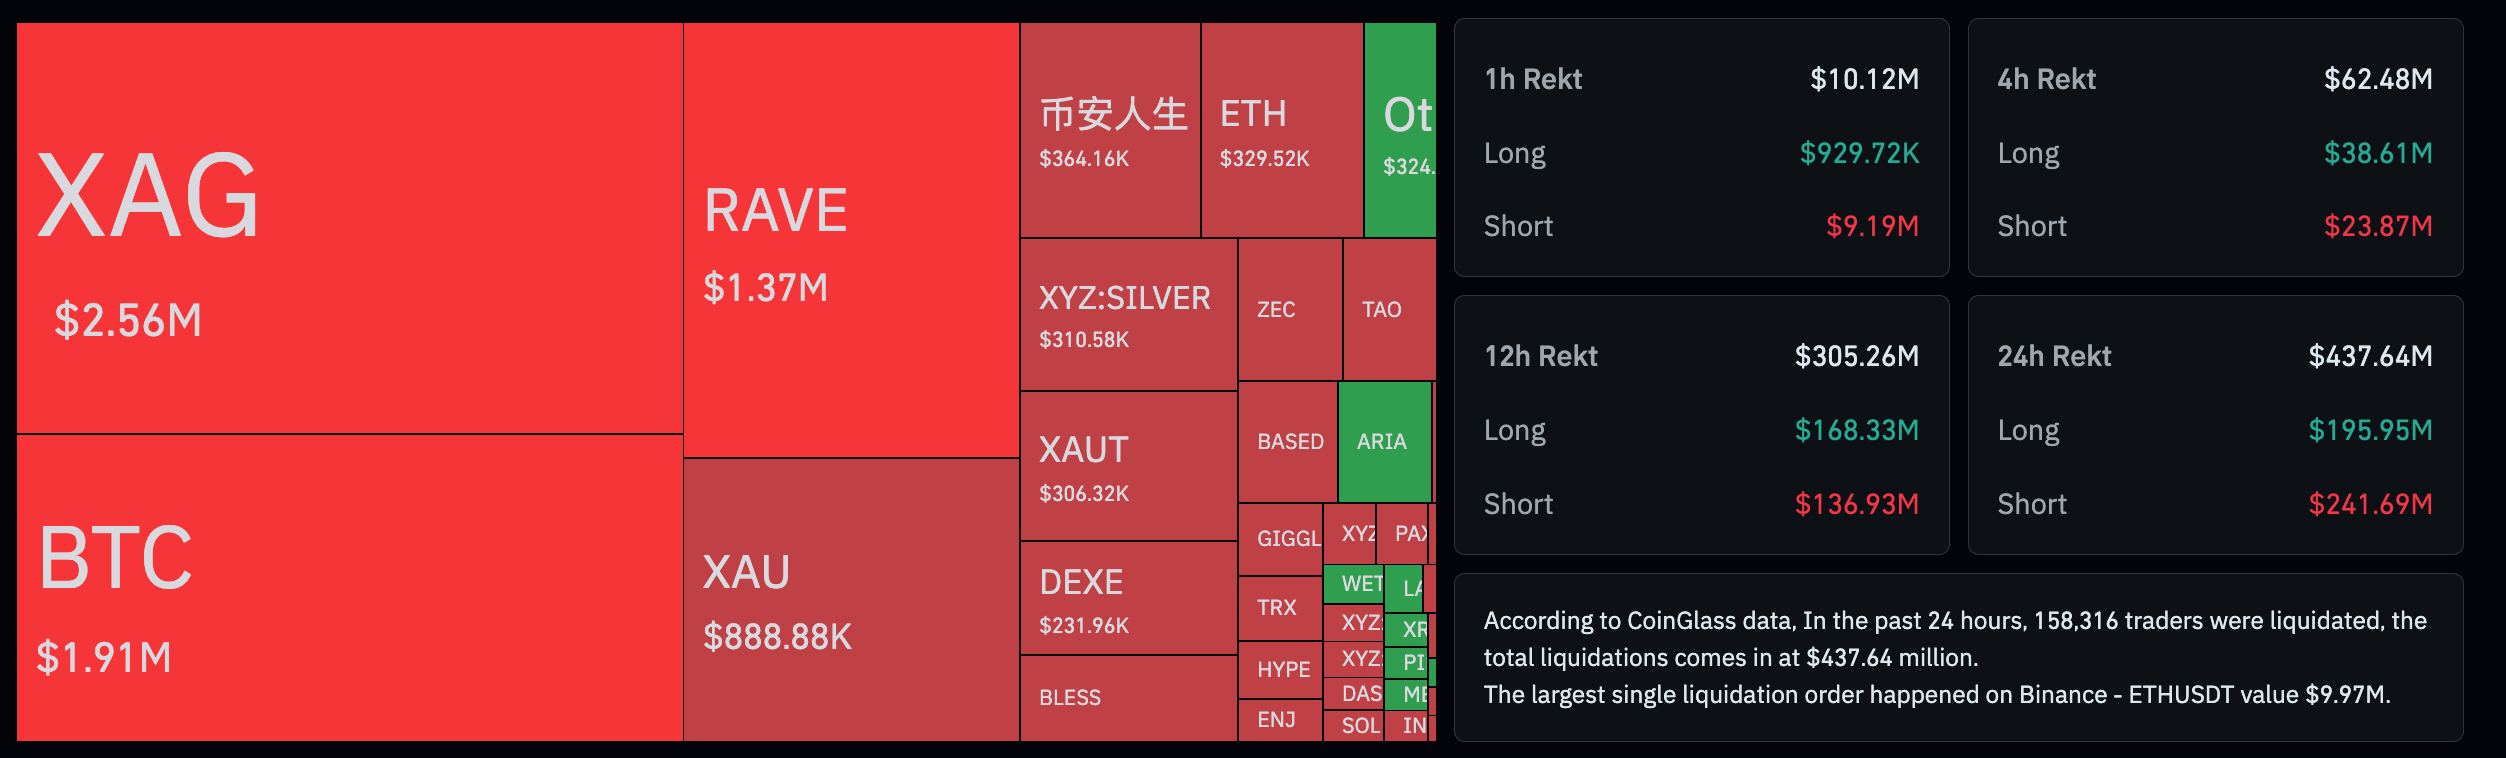
The cryptocurrency market remains volatile amid the ongoing US-Iran ceasefire talks, reflecting persistent pressure. CoinGlass data shows $437 million in total liquidations over the last 24 hours, driven by $241 million in short liquidations and $195 million in long liquidations.
Meanwhile, Bitcoin holds a constructive near-term bias as it consolidates above the 50-day Exponential Moving Average (EMA) at $71,133 while still trading below a heavier band of medium- to long-term resistance.
The Moving Average Convergence Divergence (MACD) histogram is positive and improving, and the Relative Strength Index (RSI) at 61 stays in bullish territory, suggesting buyers retain the initiative.
On the topside, immediate resistance is clustered around the 100-day EMA at $75,275, reinforced closely by the 23.6% Fibonacci retracement of the downswing from $126,199 to $60,000 at $75,623. A daily close above this band would open the way toward the 200-day EMA at $82,892 and then the 50% retracement at $93,099.
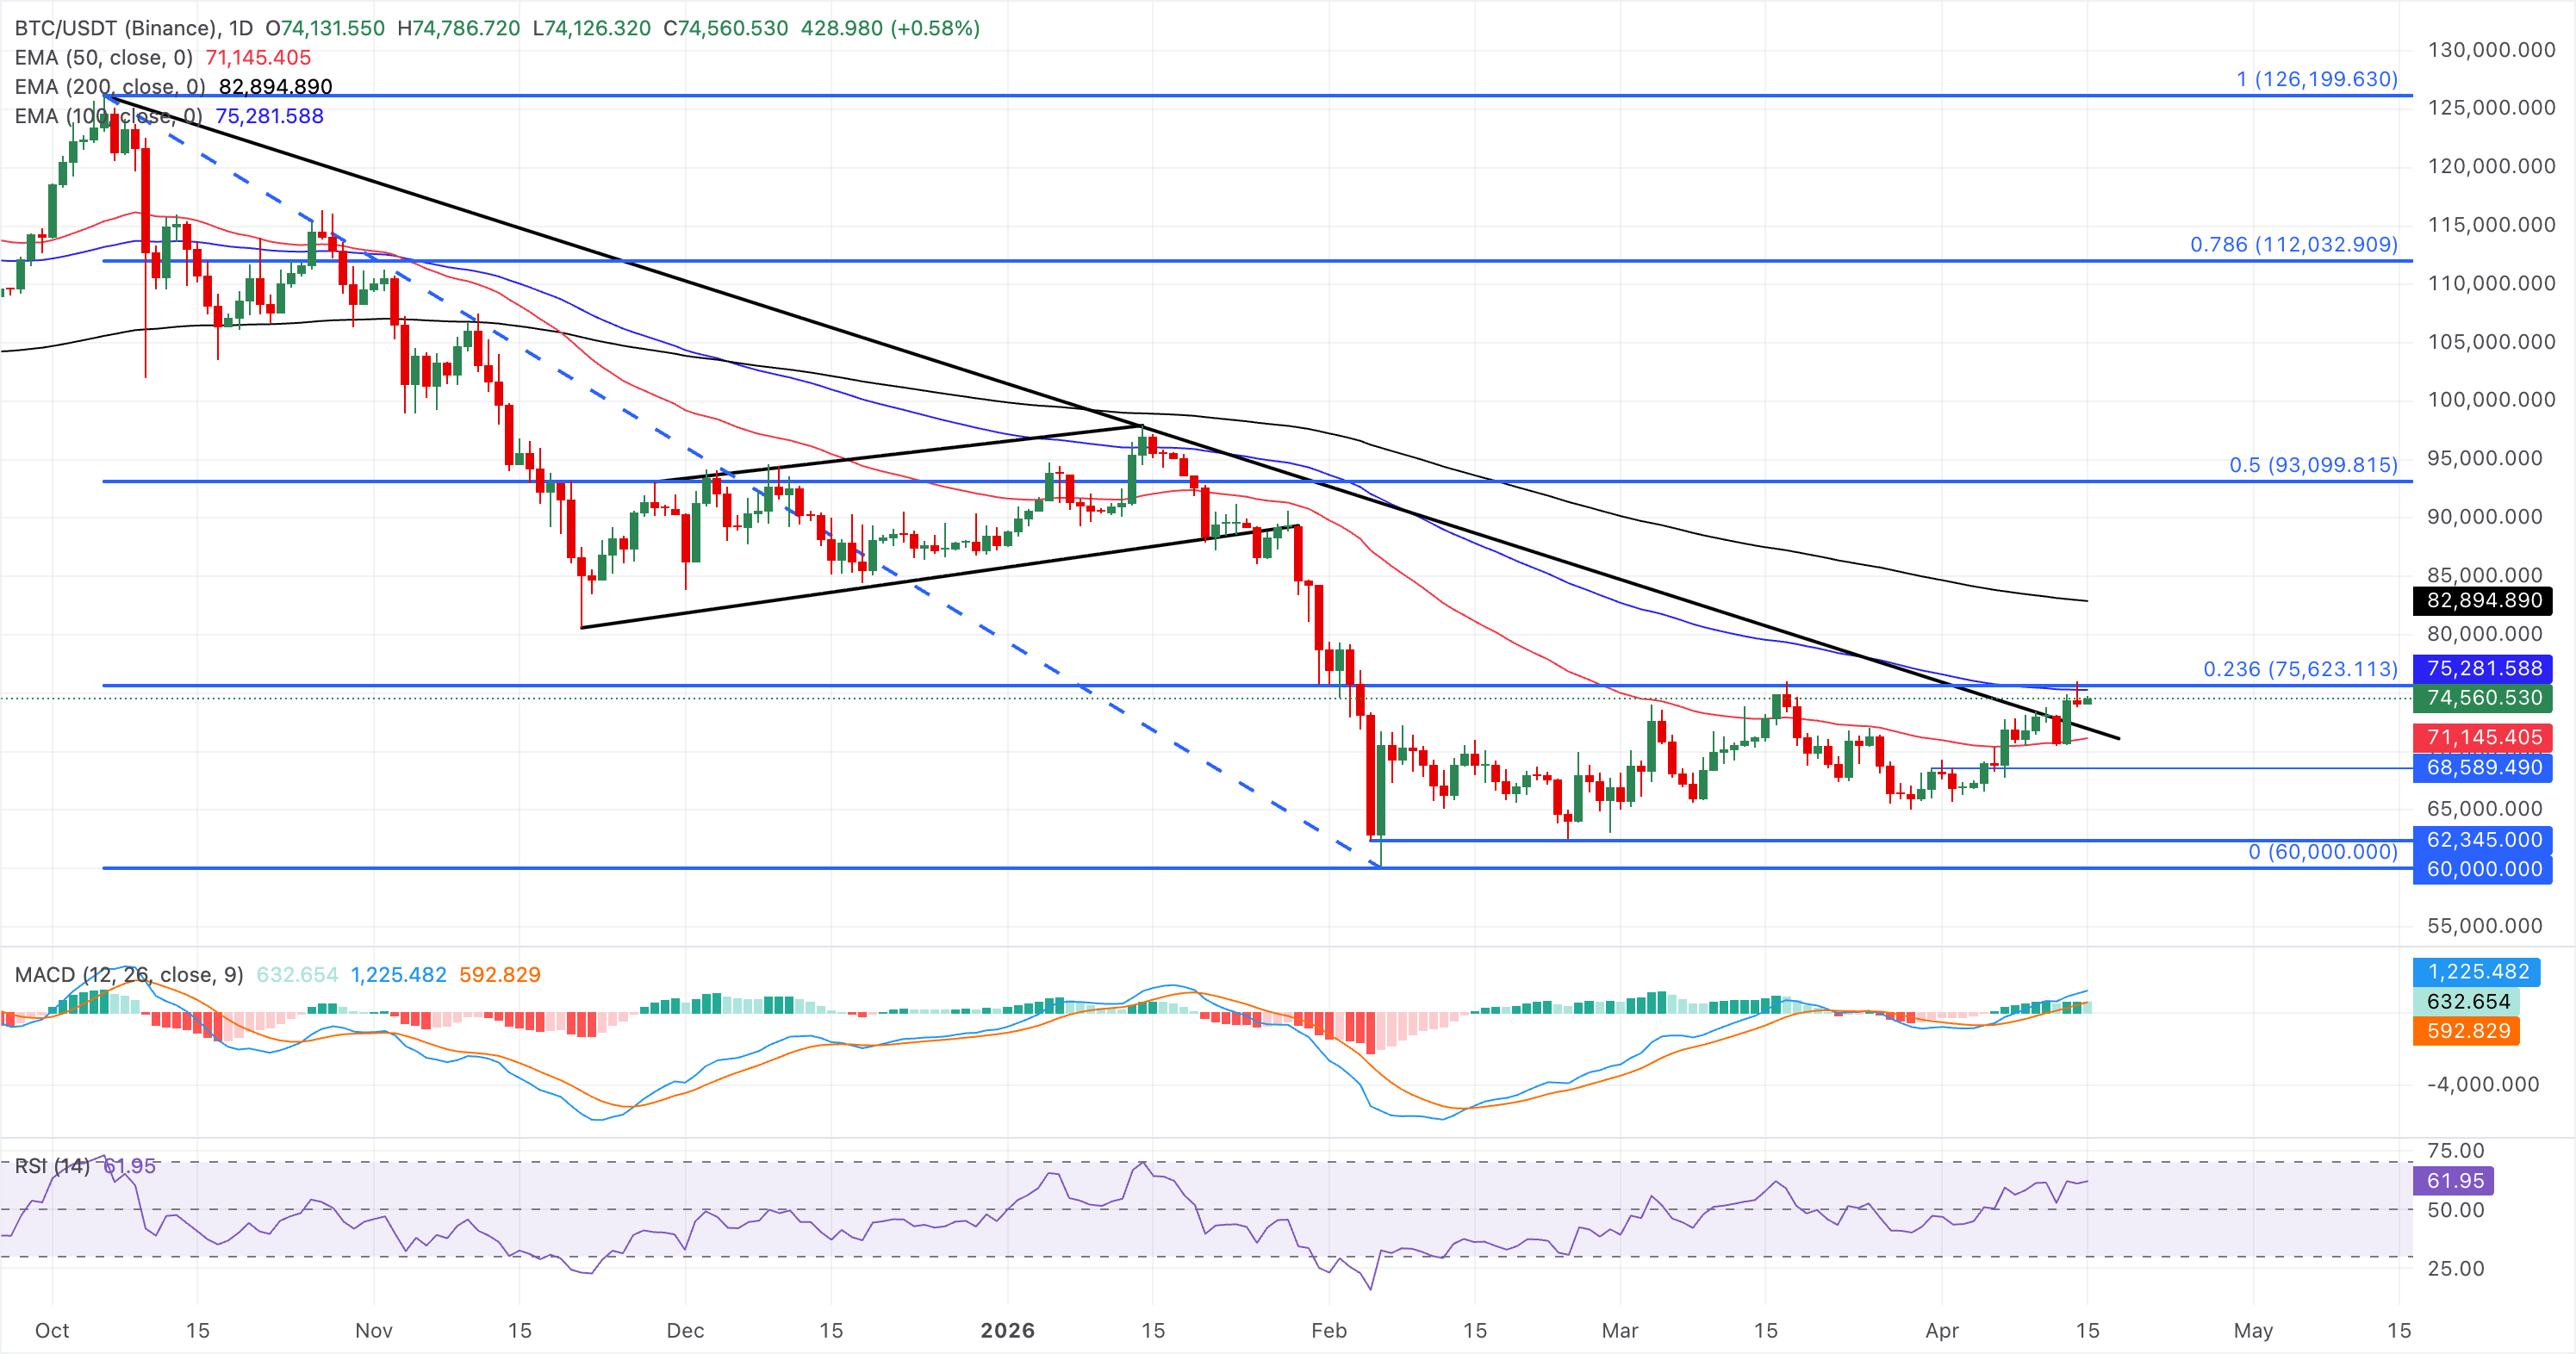
On the downside, initial support is provided by the 50-day EMA at $71,133, ahead of the rising trend-line support from prior cycle highs. Meanwhile, a deeper pullback toward the structural floor around the $60,000 Fibonacci anchor.
Top Crypto Gainers: Will RaveDAO and DeXe extend gains?
RAVE is extending a near-vertical advance well above its crucial daily EMAs, reinforcing a dominant bullish bias. Momentum readings are extreme, with the RSI near 100, signaling heavily overbought conditions even as the MACD and signal lines hold firmly positive and continue to rise.
The altcoin is in a price discovery mode, nearing the $20 round figure.
On the downside, initial dynamic support aligns with the 50-day EMA at $2.2739, ahead of the deeper trend floor at the 100-day EMA near $1.3561.
On the other hand, DeXe trades above $10 at press time on Wednesday, with intraday gains of over 16%. The recovery crosses above the 78.6% Fibonacci retracement level of the slip from $13.63 to $1.72 at $11.08.
A decisive close above this level could extend the rally toward the $13.63 swing high.
The MACD histogram remains positive and rising, suggesting upside momentum persists despite the RSI hovering at 82 in overbought territory.
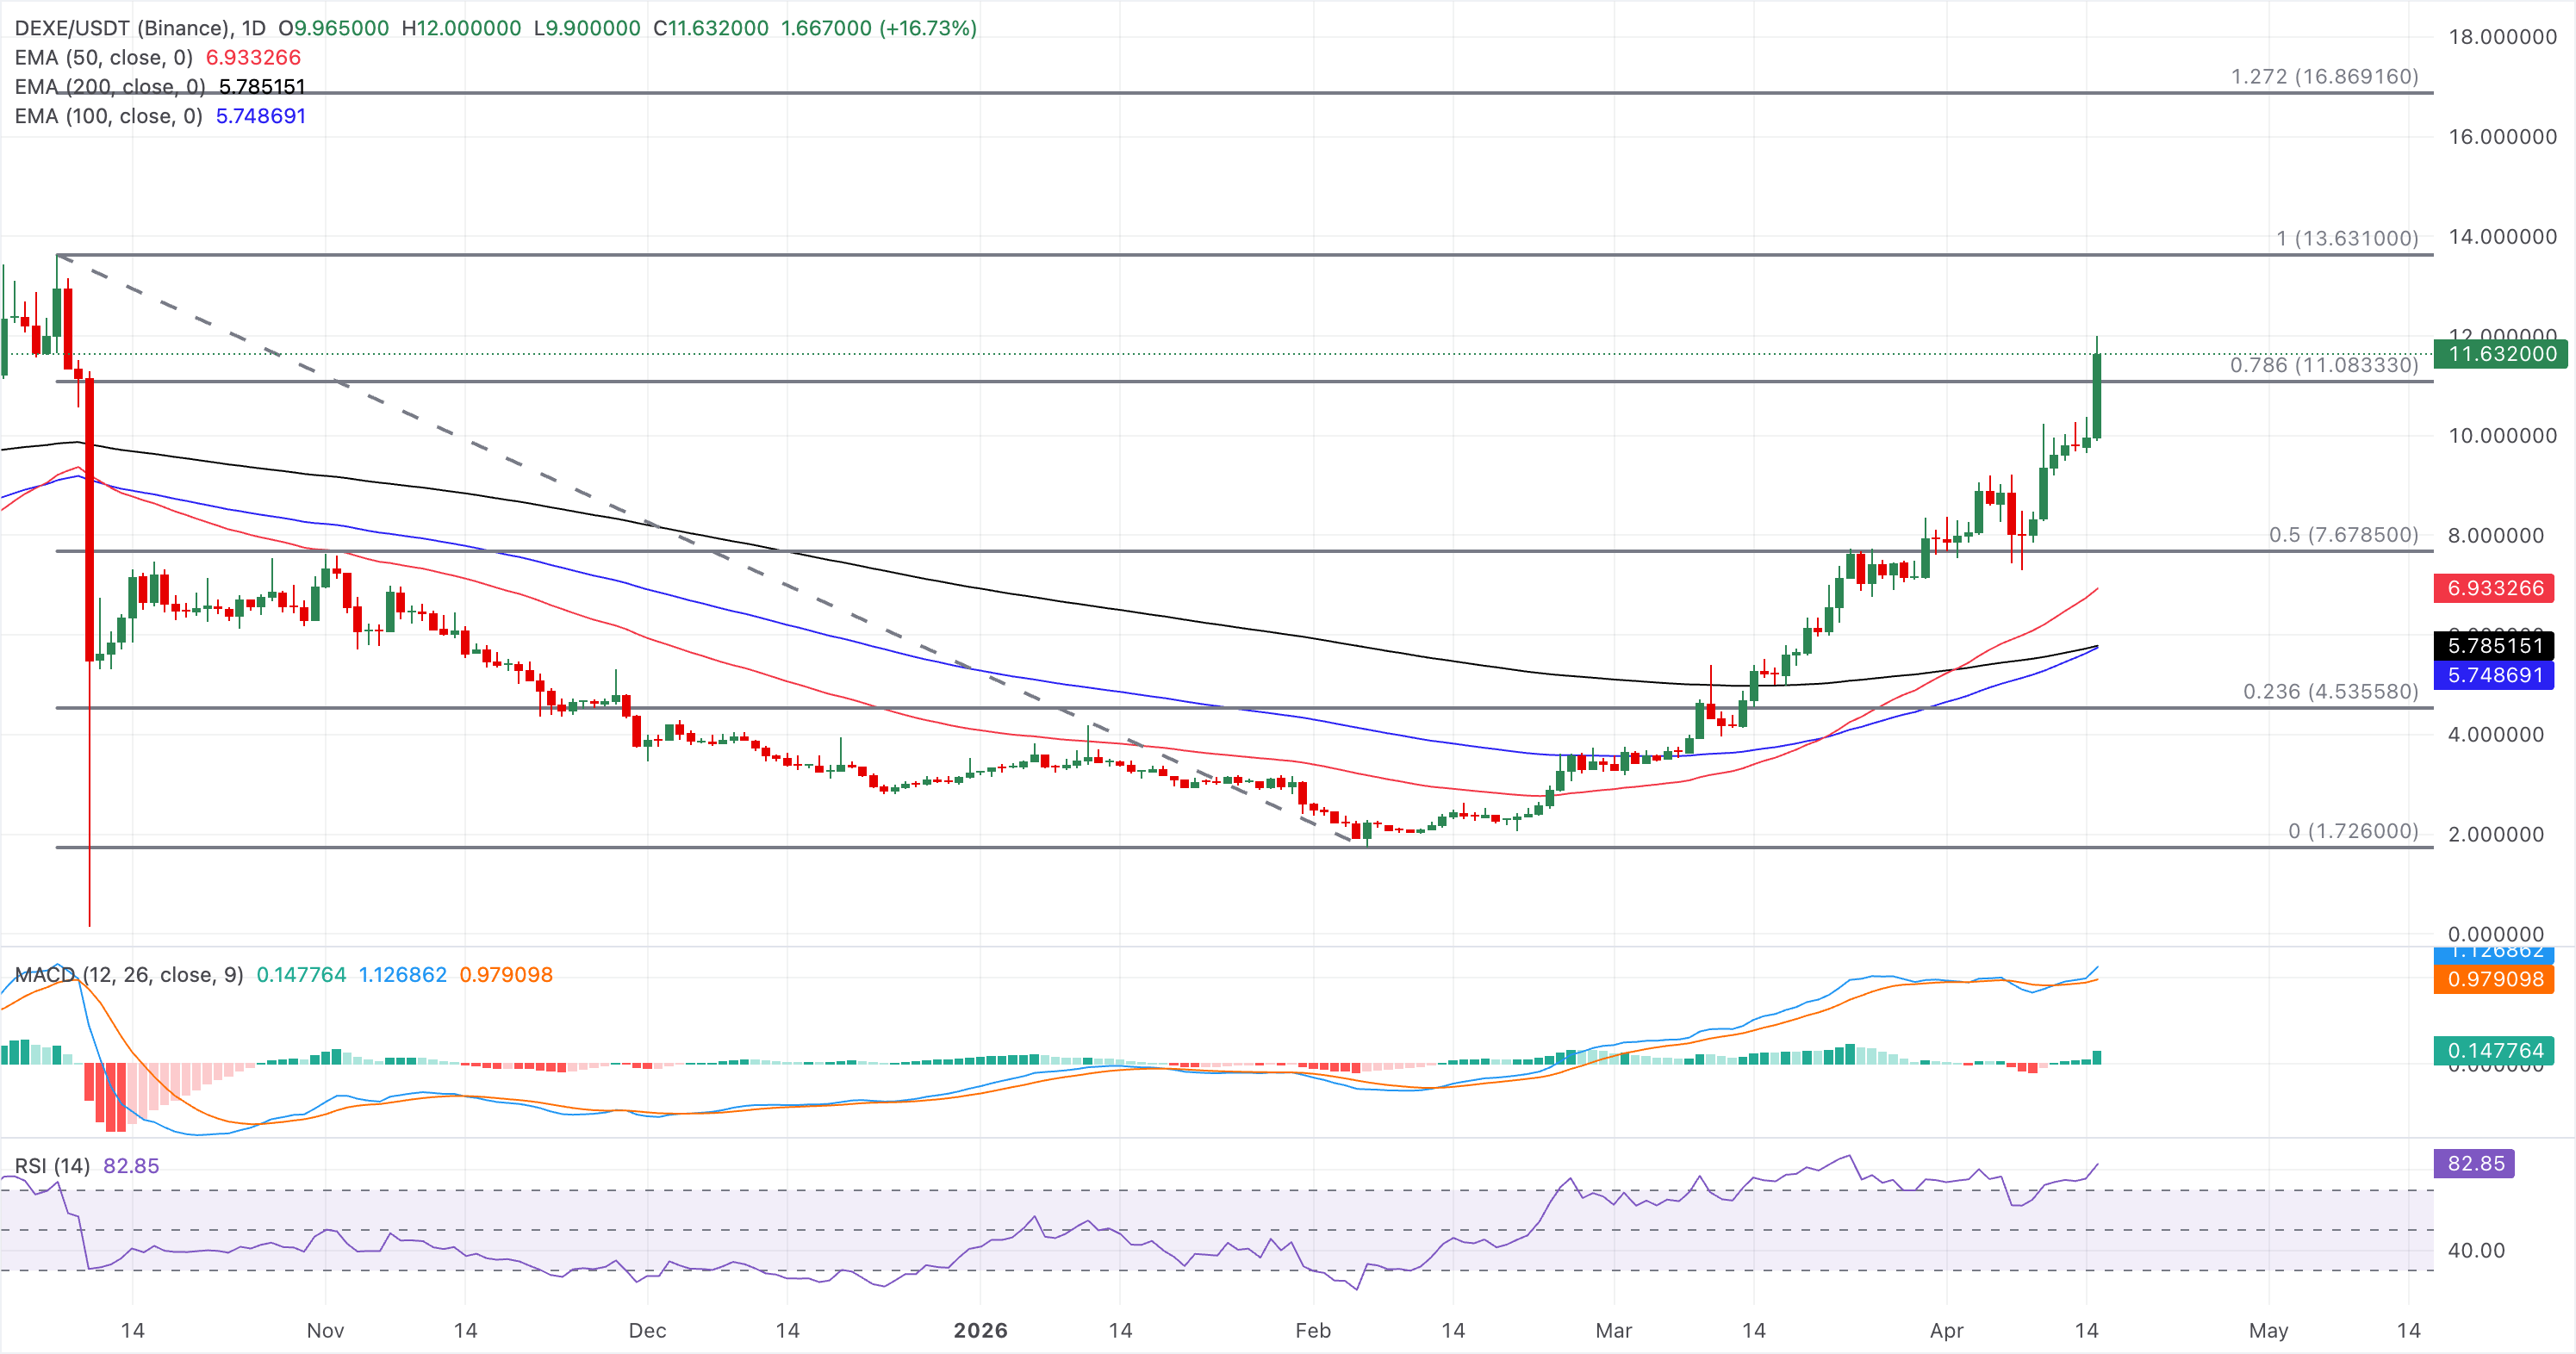
On the flip side, the 50% retracement level at $7.67 and the 50-day EMA at $6.93 serve as crucial support levels.
(The technical analysis of this story was written with the help of an AI tool.)
Recommended Articles








Comments (0)
Click the $ button, enter the symbol, and select to link a stock, ETF, or other ticker.