


Bitcoin Futures Flow Pattern Just Matched The Post-FTX Setup. Discover What Happened In 2022



Bitcoin is trying to reclaim $75,000. The debate about where it goes next has not been this divided in months. And while analysts argue about whether the bottom is in or still coming, the on-chain data has quietly produced a pattern that most of them are not discussing.
CryptoQuant analysts tracking Bitcoin’s exchange flow structure have identified a development that sidesteps the opinion divide entirely: since March, the flow of Bitcoin into futures exchanges — rather than spot exchanges — has been intensifying in a pattern that closely mirrors the behavior observed following the FTX collapse in December 2022.
That comparison carries weight precisely because of what it is not. It is not a price comparison. It is not a sentiment comparison. It is a structural behavioral match — the specific way capital was flowing through exchange infrastructure at the moment the last bear market bottomed and the next cycle began. The pattern appeared then. It is appearing now.
The analysts calling for a drop below $60,000 are reading the price chart. The analysts calling for a slow recovery are reading the macro environment. Neither group is talking about what the futures flow data is saying — which is that the market’s structural behavior is beginning to resemble something the on-chain record has seen before, at a moment that, in retrospect, mattered enormously.
The Pattern Is Present. The Confirmation Is Not Yet
The CryptoQuant analysts draw the interpretation carefully — and the care is warranted. The intensification of Bitcoin flows into futures exchanges rather than spot exchanges, mirroring the post-FTX behavior from December 2022, points toward a specific structural development: leveraged positioning is returning to the market.
Traders are not just holding Bitcoin. They are beginning to use it as collateral for directional bets — the behavioral signature of participants who believe a sustained move is approaching and want amplified exposure to it.

That behavior, appearing at this price level and this stage of the cycle, carries a specific historical implication. The last time this pattern emerged — following the FTX collapse, at what proved to be the cycle bottom — it marked the early stages of a new cycle rather than a continuation of the bear market. The analysts’ assessment follows that directly: the bear market may be drawing to a close.
The word “may” is doing necessary work in that sentence. Bitcoin is struggling to find direction after weeks of consolidation, and the market has not yet produced the price confirmation that would convert the structural signal into a declared trend reversal. The futures flow pattern describes what participants are doing. It does not yet describe where the price is going.
Two conditions currently coexist: a structural behavioral signal that historically preceded cycle recoveries, and a price chart that has not yet decided to reflect it. That gap — between what the on-chain data suggests and what the price has confirmed — is exactly where the market has lived for weeks. The resolution of that gap is the move the market has been consolidating toward.
Bitcoin Tests Resistance as Recovery Attempts Strengthen
Bitcoin is pushing toward the $74,000–$75,000 region, testing a key resistance zone after recovering from the sharp February breakdown. The chart shows a clear transition from capitulation to consolidation, followed by a gradual series of higher lows. This structure suggests that buyers are regaining control in the short term.
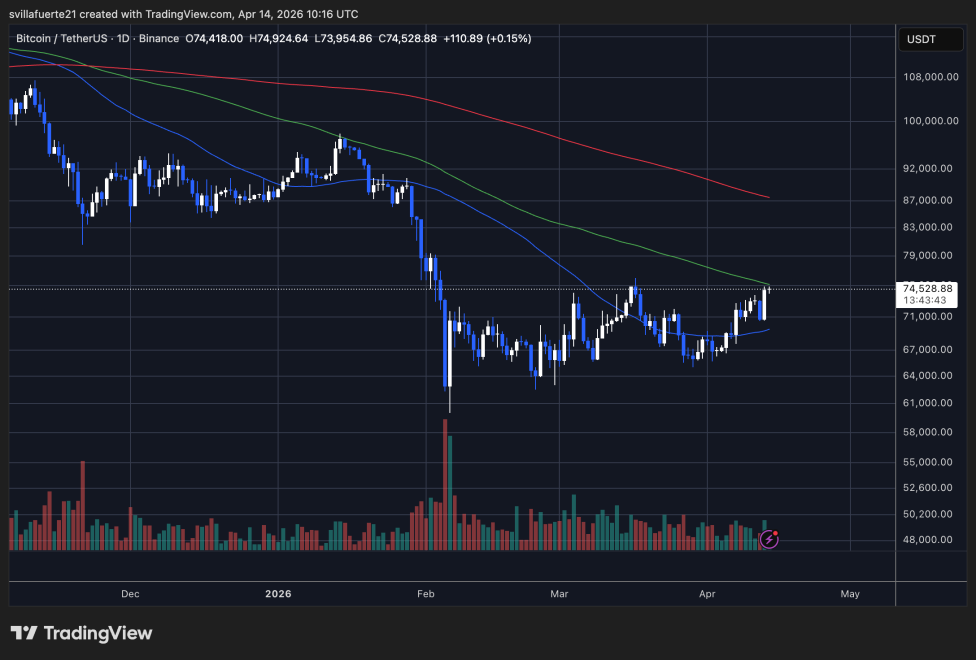
However, the broader trend remains unresolved. BTC is still trading below the 100-day (green) and 200-day (red) moving averages, both trending downward, which reinforces the presence of overhead resistance. The 50-day moving average (blue) has started to turn upward and is acting as dynamic support, indicating improving short-term momentum.
Volume dynamics provide important context. The spike during the February sell-off reflects forced liquidations, while the subsequent normalization suggests the market has stabilized but lacks strong conviction. The recent push higher has not been accompanied by a significant increase in volume, raising questions about the strength of the move.
Structurally, Bitcoin is approaching a decision point. A confirmed break above $75,000 would likely shift momentum and open the path toward the $80,000–$85,000 range. Failure to break higher could result in another rejection and a return to the $68,000–$70,000 support zone.
Featured image from ChatGPT, chart from TradingView.com
Recommended Articles








Comments (0)
Click the $ button, enter the symbol, and select to link a stock, ETF, or other ticker.