


Ethereum About To Turn? Death Cross Says Bottom Is Closer Than You Think



Ethereum may be closer to a major turning point than it appears, as key technical signals begin to align. Despite recent weakness, the emergence of a death cross, often seen near the end of downtrends, suggests the market could be approaching its final phase of capitulation. With historical patterns pointing to a nearing bottom, attention is shifting from fear to opportunity.
Worst-Case Scenario: Final Phase Of The Bottoming Process
In outlining a worst-case scenario for Ethereum, crypto analyst Sykodelic explained that if the market has not yet fully bottomed, it is likely in the final 2%–3% of the overall bottoming process. Such a narrow margin suggests that while some downside risk may remain, the majority of the correction has already played out, placing price action near a potential exhaustion point.
Historical behavior tied to the Death Cross on the 3-day chart further supports this perspective. In past cycles, Ethereum has either bottomed right at the moment of the death cross or very shortly afterward. Only one instance deviated slightly, with the market taking additional time before forming a final low.
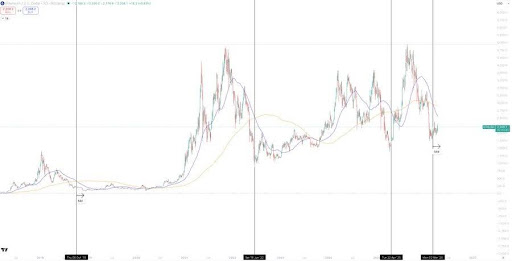
A death cross occurs when the 50-day moving average crosses below the 200-day moving average, indicating a market that is deeply compressed and overextended. While often interpreted as a bearish signal, in many cases, it marks the late stages of a downtrend, where selling pressure begins to fade, and long-term buyers gradually step in.
If Ethereum follows this historical pattern under a worst-case scenario, the final bottom could emerge roughly 54 days after the death cross, placing the projected timing around April 28. Expecting a significantly longer bottoming phase would be inconsistent with past cycles and may be unlikely, especially considering that the current market expansion has been relatively weak. With downside likely limited and the bottoming phase nearing completion, the focus increasingly shifts toward strategic accumulation rather than panic selling.
ETH Struggles Below Key $2,300 Resistance Zone
According to Chad, Ethereum is still not ready to break above the upper daily Bollinger Band and the key horizontal resistance zone around $2,300. Price continues to struggle in this region, showing repeated signs of rejection, which suggests that bullish momentum remains insufficient for a sustained breakout.
So far, market structure is unfolding as expected, with key levels being respected on both sides. The inability to reclaim the $2,300 zone reinforces the idea that ETH is still in a consolidation phase.
Attention now shifts to the downside, where a crucial confluence area sits around $2,150. This level combines a strong horizontal support zone with the 20-day SMA, making it a key level to watch. A breakdown below this region could open the door for further downside, while a successful hold may signal stability and set the stage for another attempt at higher levels.
Recommended Articles









Comments (0)
Click the $ button, enter the symbol, and select to link a stock, ETF, or other ticker.